
-p-130x130q80.png)
The Google-acquired Dataform offers data transformation for cloud data warehouses (DWHs) such as BigQuery, Redshift, and Snowflake. Unlike traditional ETL, Dataform is a platform for managing data in ELT format, where data is extracted from the source, added to the DWH, and then transformed. At datadice, we use Dataform to manage data in BigQuery before using it in Looker Studio, our flagship data visualization solution, and Power BI.
In my previous post, I wrote introductory notes about Dataform. In this post, however, I will focus on how to use Dataform inside GCP’s BigQuery and give you step-by-step instructions to get started with the tool. To follow the instructions, you will need to sign in to your GCP account. To collaborate with your teammates on a data transformation project, you may need a Git repository.
Let's get started!
1. Setup
Before working on Dataform, you must enable the Dataform and BigQuery APIs.
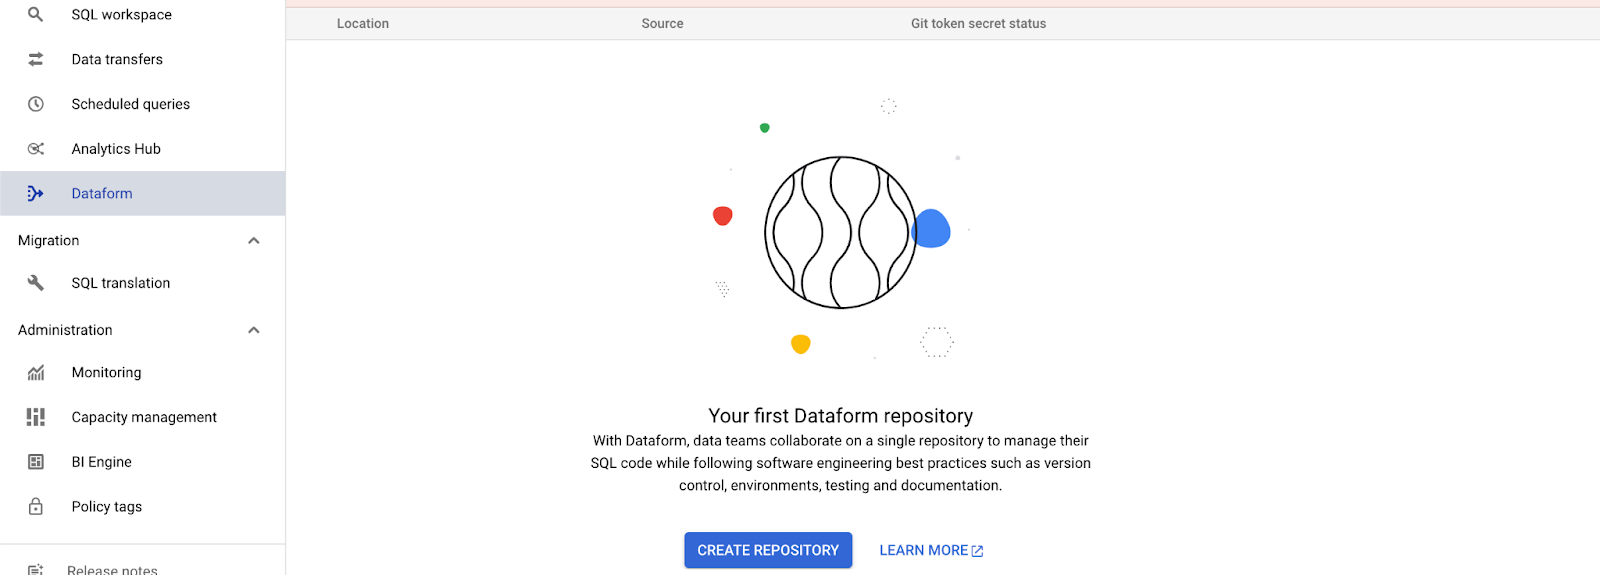
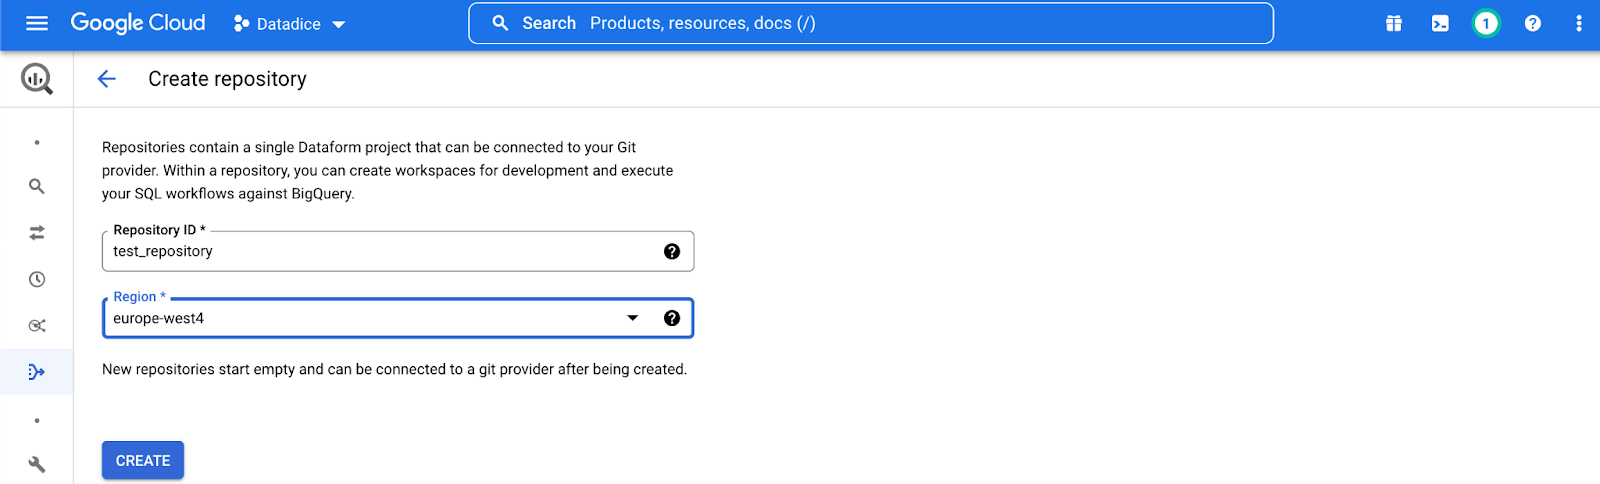
To create your first repository, go to the Dataform page and click Create Repository. Then on the Create repository page, give your repository a name, select a region, and then click Create.
To execute workflows in GCP, you need to grant the Service Account from Dataform access to BigQuery. Depending on the project, you can select one of the following roles: BigQuery Data Editor (both read and write), BigQuery Data Viewer (read-only), and BigQuery Job User (hosting your Dataform repository).
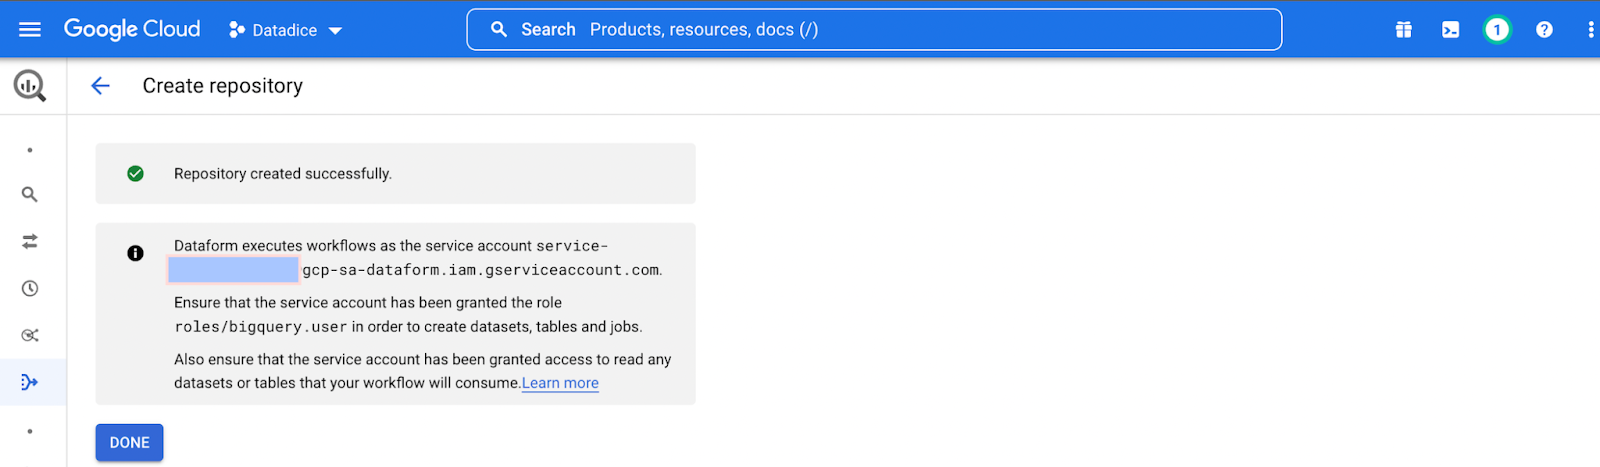
Clicking Done will lead you to an empty repository.
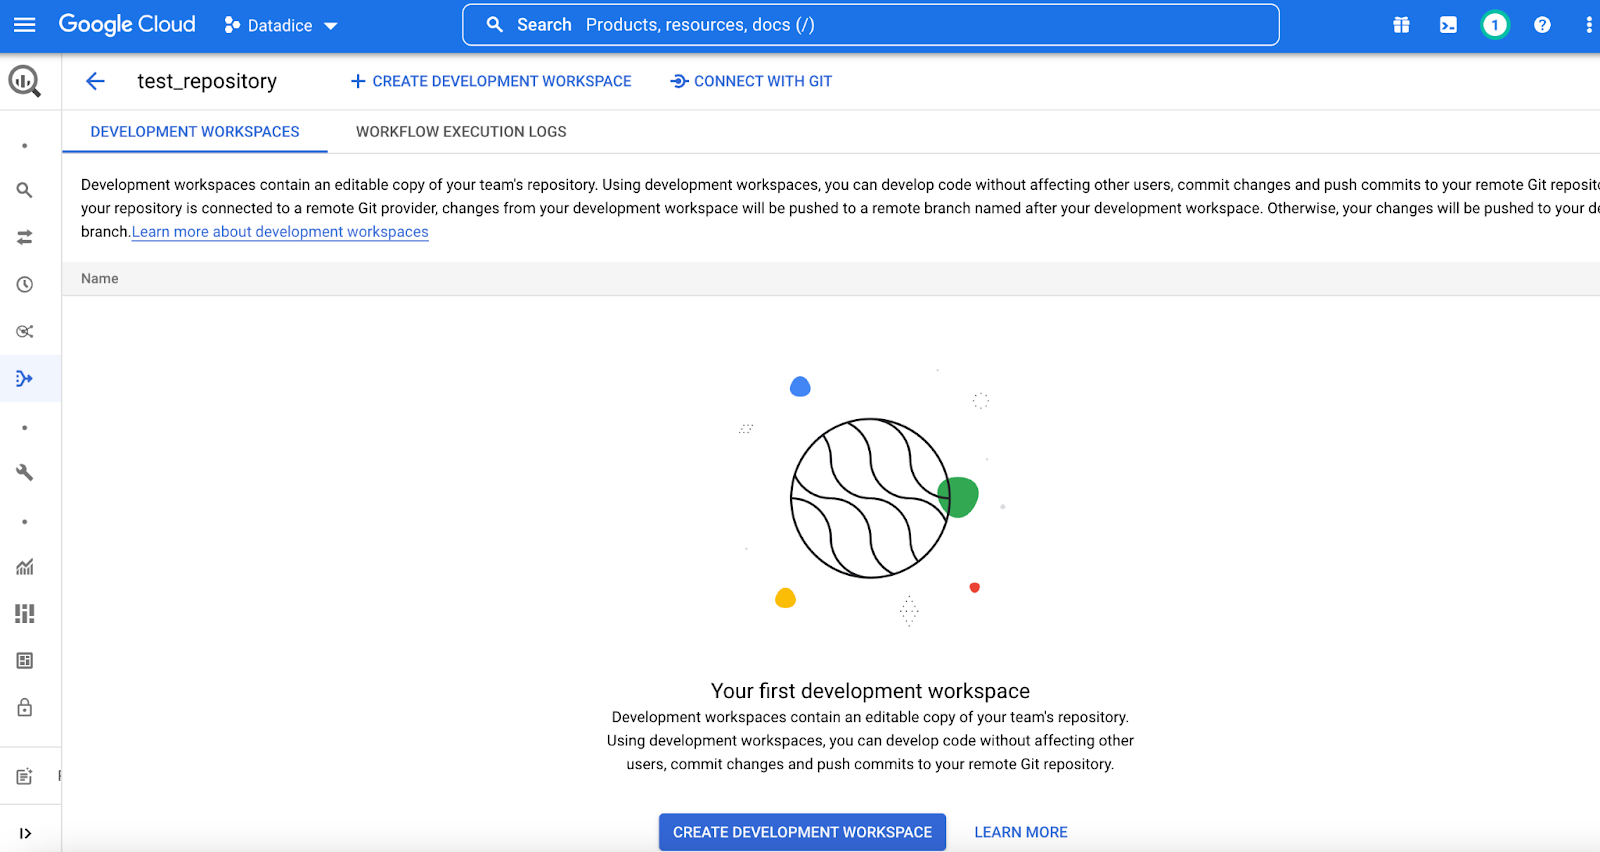
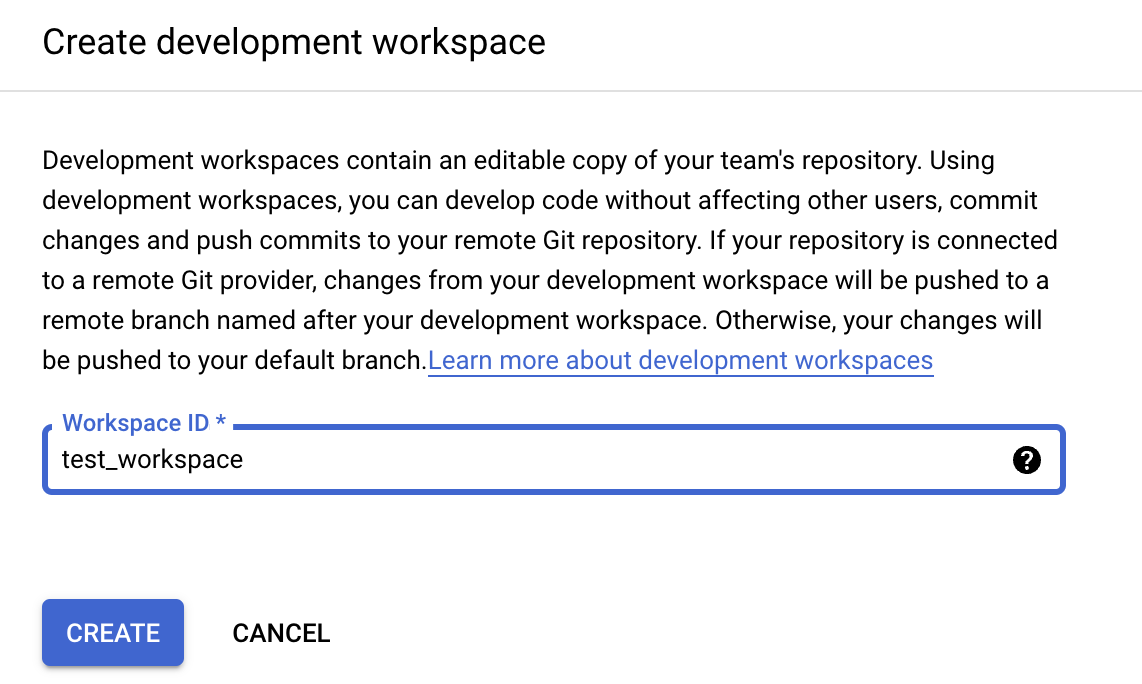
Enter the Workspace ID and click Create.
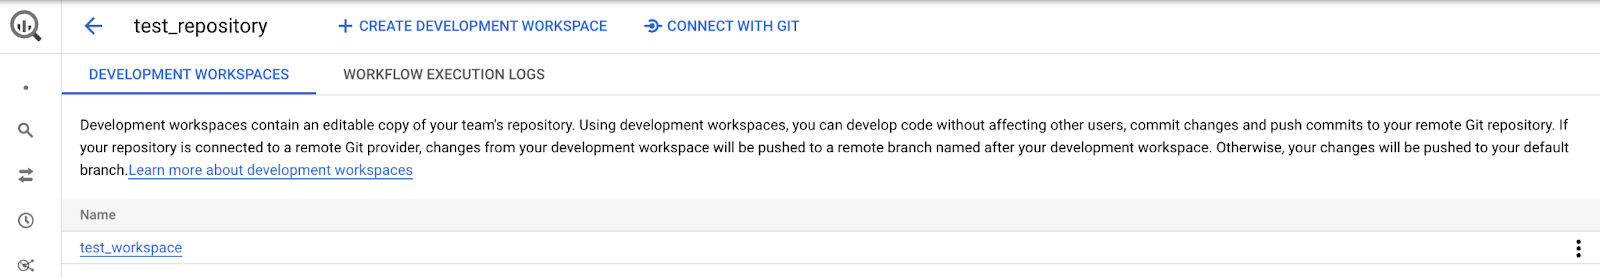
When the development workspace page appears, click Initialize workspace.
2. Create or declare data sources
In Dataform, it is possible to create views using SQLX, an open-source extension that brings additional functionality to SQL. SQLX makes development faster, more scalable, and more reliable with modular queries instead of long ones. It enables functionalities such as data documentation, automated quality checks, and dependency management.
To organize our project, let's create the following subfolders: sources, staging, and reporting.

To do this, click the three dots next to definitions and choose Create Directory.
2.1 Create tables/views
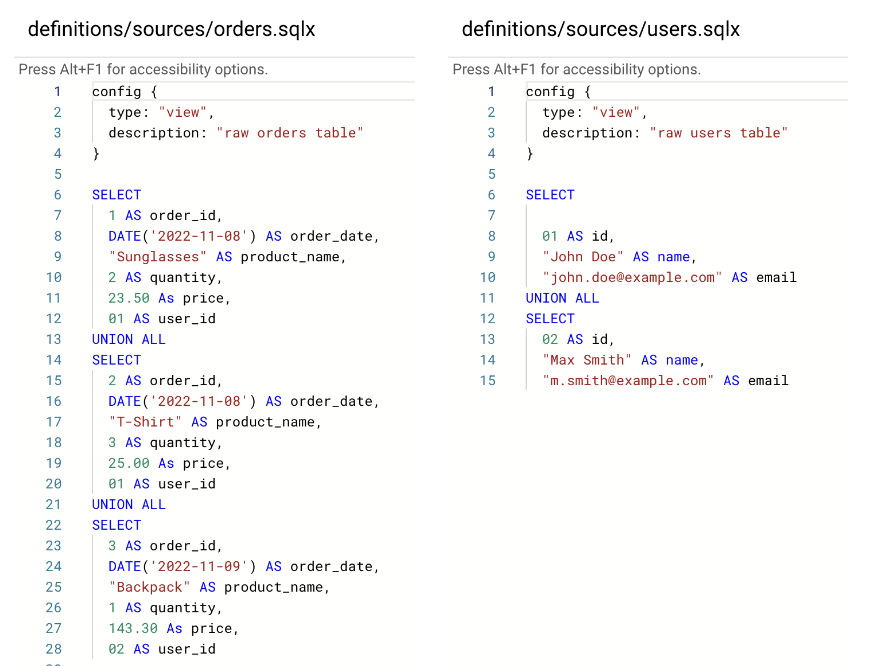
Let us now create tables or views as data sources from scratch. To do so, click on the three dots next to the “sources” directory and click on Create file. And then, create two views with the names orders.sqlx, and users.sqlx. Then, write your codes in each file as shown below.
Well done! You created your first table with Dataform.
2.2 Declare data sources
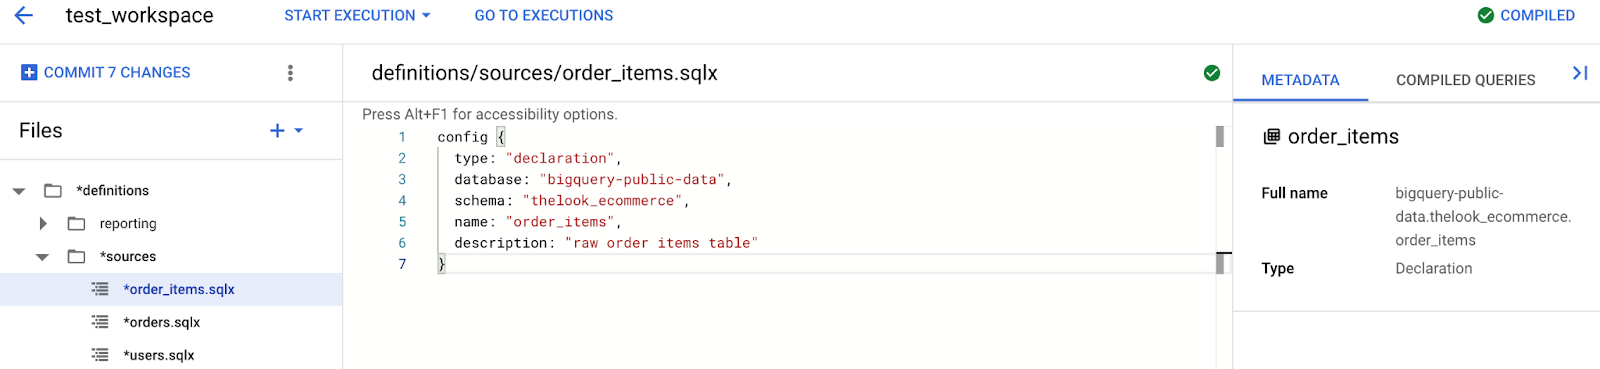
If the data is already in BigQuery, you can declare sources instead (as shown below). Note that these are declaration-type tables. To configure the main characteristics of the declaration in BigQuery, you can use config{ } as shown in the example below.
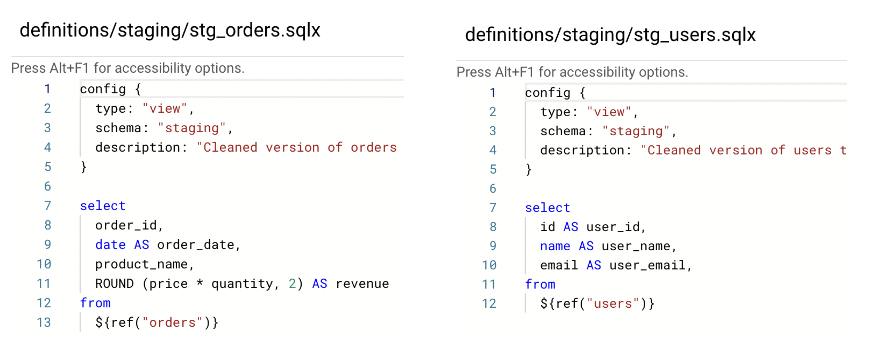
3. Staging: Create intermediate views and tables
You can use the ${ref( )} function to refer to the tables and views defined in your Dataform project. Furthermore, it is possible to build a dependency tree of all tables to ensure that processing is done in the correct order. You can use syntaxes like ${ref("orders")} as in the example below. It is also possible to configure the main characteristics of the view implementation in BigQuery via config{ } in the code header.
Click on the three dots next to staging and create the two .sqlx files:
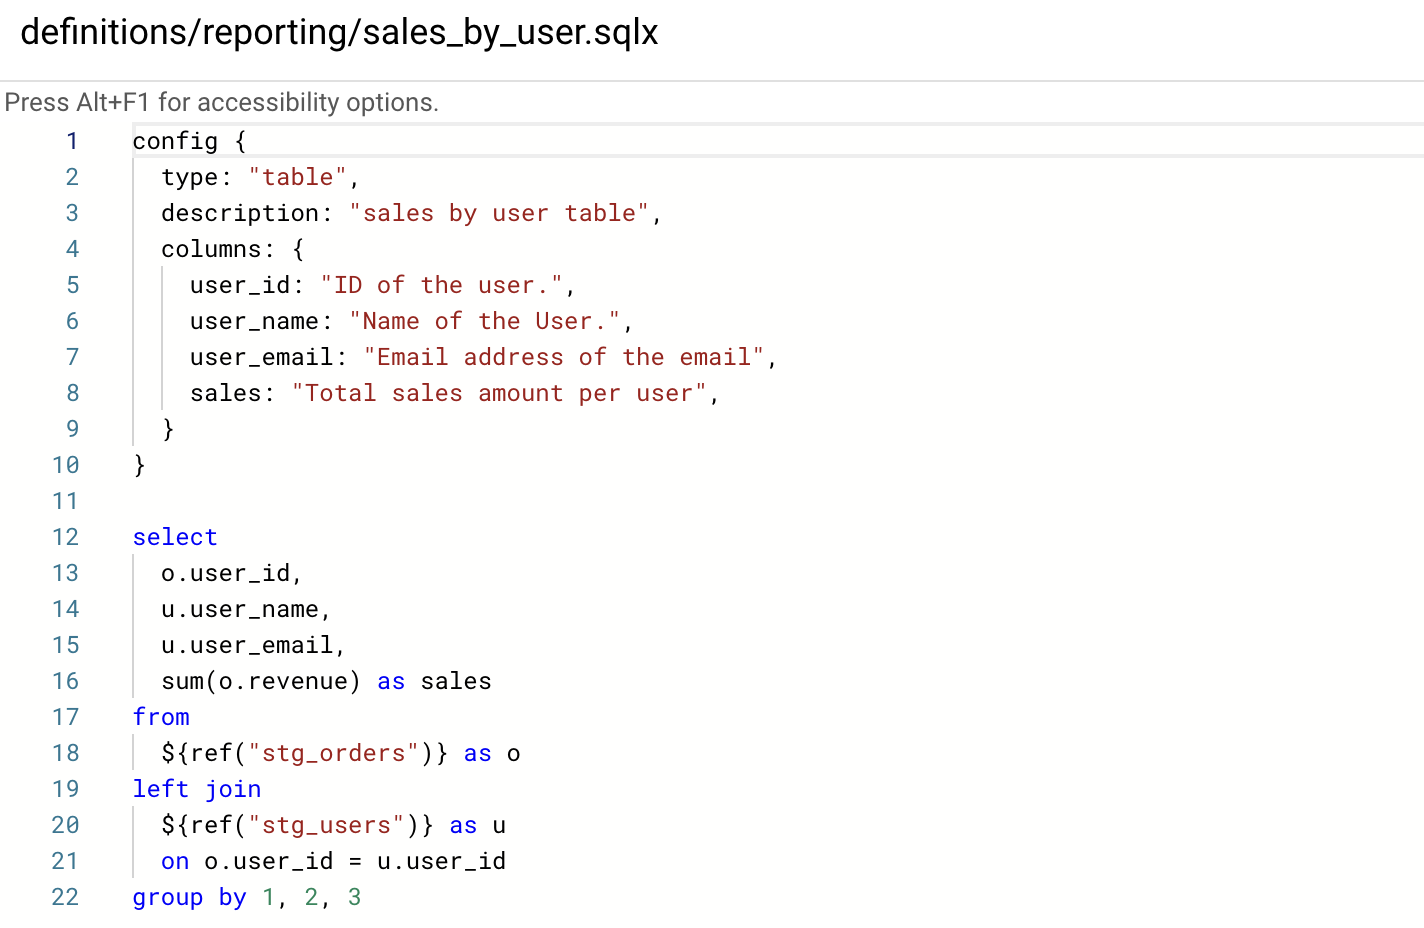
4. Create the reporting table
Now create the sales_by_user.sql file in the reporting subfolder. This transformation combines both the users and orders in the same table. For example, the resulting table will contain columns for the user's name, email address, user ID, and order sales amount.
5. Data quality test
Dataform lets you perform data quality checks using the following built-in functions.
- uniqueKey: makes sure there is only one row per value of the given column(s);
- nonNull: confirms that the fields are not null;
- rowConditions: Uses a custom SQL expression. If this expression is FALSE for any row, the check fails.
You can also write your assertions using SQLX. SQLX is a powerful tool for easily writing and maintaining assertions about your data. In the background, Dataform will write a query to identify rows that violate the rules you specified. If the query returns any rows, the assertion will fail. With this information, teams can build confidence that their data is reliable and accurate, enabling them to make informed decisions and drive better results.
6. Document your data
You can document your data within Dataform by adding descriptions of tables and columns in the config block of SQLX files.

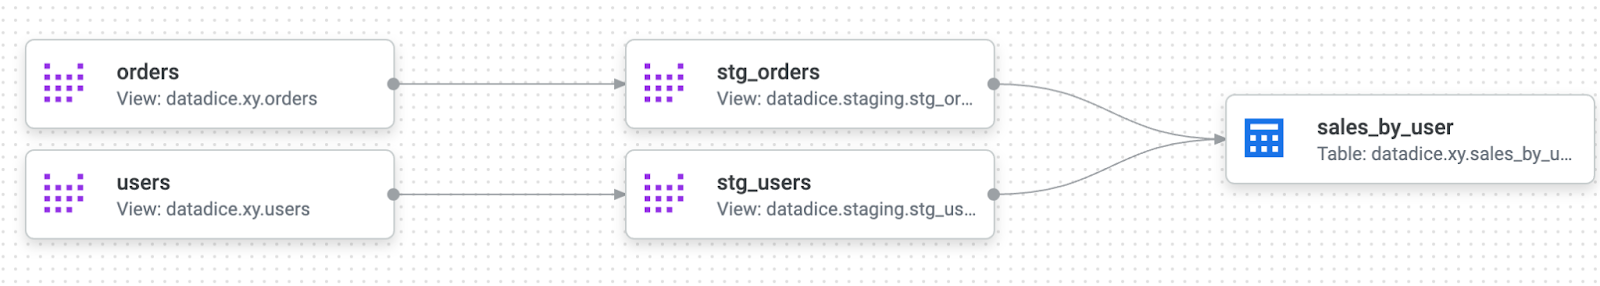
7.Compiled Graphs
Once you have created SQLX files, Dataform will automatically generate a compiled graph. This graph shows the data from all sources in one place, allowing for easy comparison and analysis. It shows a dependency tree and the relationships between different datasets. This helps to identify data discrepancies. It can also provide insights into the data that may be difficult to identify otherwise.
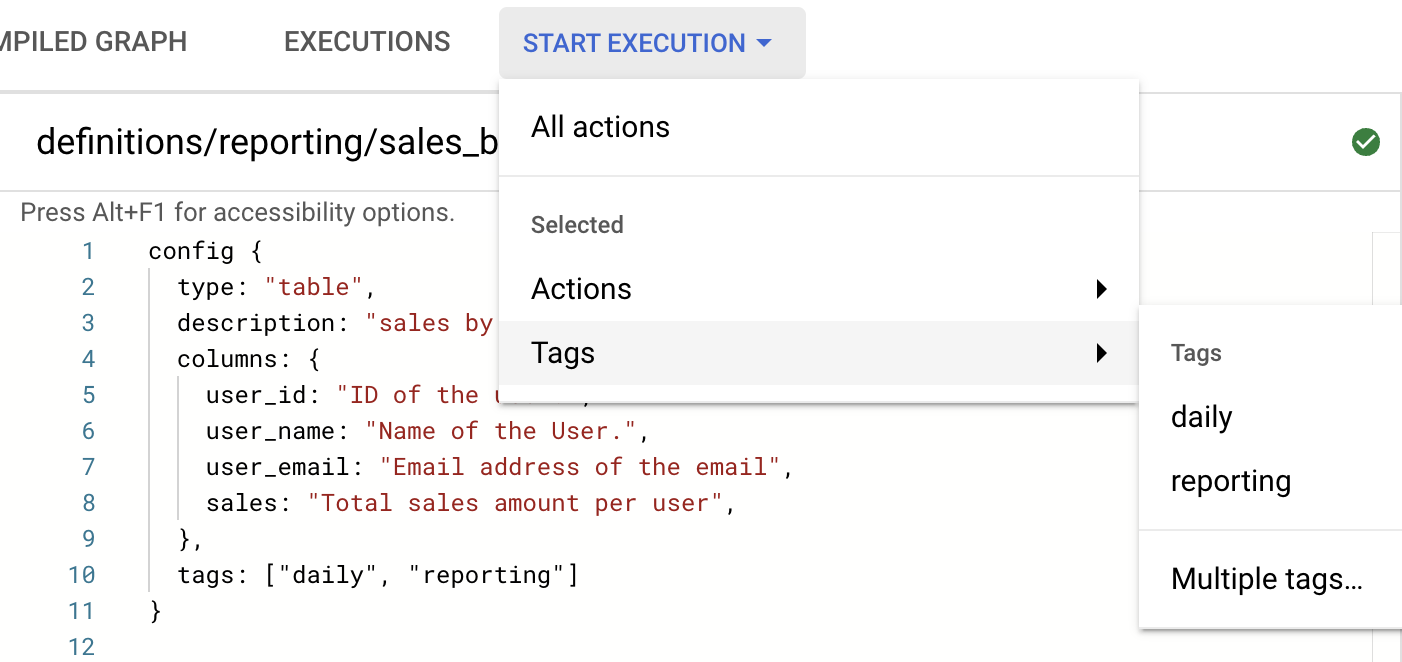
8. Execute your project
Jobs in Dataform can be run both manually and automatically. During manual execution, you can execute the entire project, a tag selection, or a selection of actions with the option of including non-dependencies and dependents. Additionally, you can run the job with a “full” refresh, which deletes and re-creates incremental datasets from scratch as needed. It is good practice to use tags to manage your schedules.
After execution, the user_by_sales table will be created/updated inside BigQuery.

In principle, you can automate the process of execution. In contrast to the legacy version, automatic execution isn't currently available in Dataform directly within BigQuery. In any case, you can run scheduled executions through Workflows and Cloud Scheduler.
As of March 2023, it is possible to preview your queries within your workspace. This is a valuable addition as it helps you see the results of your queries. This allows you to quickly identify any errors in your query and revise it accordingly. It also gives you the opportunity to optimize your query before executing it, thus improving your performance.
9. Integration with GitHub
As discussed earlier, Dataform offers a lot of benefits for data teams by bringing the best practices of software development. With Dataform, it is possible to do continuous integration practices thanks to its connection to development environments such as GitHub. As Dataform provides different branches, there are ways to perform isolated runs without affecting tables or datasets in other teams or environments.
Once you have signed in and have your Git repository set up, you can begin using Dataform to transform your data. From there, you can run your data transformations, analyze the results, and collaborate with your teammates. Finally, you can share the insights with your stakeholders and get feedback. After you have completed your data transformation project, you can use this same Git repository to save your code and share the results with your teammates. This will make it easier to access and review the project, and keep everyone on the same page.
10. Conclusion
It is imperative to note that Dataform is not an ETL tool in the conventional sense, but a tool for data transformation. In short, it is the “T” in ELT format. Through the use of this tool, the entire team can work together to build a single source of data within the company. This allows data to be properly standardized and organized, creating clean datasets that can be effectively used for analysis and data-driven decision-making. Additionally, Dataform simplifies the management of the organization's data pipeline and reduces its complexity.
Dataform now belongs to the Google Cloud Platform. With its integration into GCP, Dataform is now more accessible than ever. This allows users to access the data transformation capabilities of Dataform with the rest of Google Cloud Platform services. It also provides users with the ability to analyze, transform, and visualize their data quickly and easily.
All in all, with Dataform, you can easily manage and deploy your data pipelines, create custom queries, and automate data jobs - all within the convenience of your GCP account.
For more information on how to get started with Dataform in BigQuery, please refer to the following documentation.
- Overview
- Concepts
- Quickstart: Create a SQL workflow and execute it in BigQuery by using Dataform and Dataform core
Further Links
The article is the second part of the series Creating Data Pipeline with Dataform in BigQuery from datadice. This post introduced Dataform, an integrated development environment for your data team.
Check out our LinkedIn account, to get insights into our daily working life and get important updates about BigQuery, Data Studio, and marketing analytics
We also started with our own YouTube channel. We talk about important DWH, BigQuery, Data Studio, and many more topics. Check out the channel here.
If you want to learn more about using Google Data Studio and taking it to the next level in combination with BigQuery, check out our Udemy course here.
If you are looking for help setting up a modern and cost-efficient data warehouse or analytical dashboard, email us at hello@datadice.io and we will schedule a call.


.jpeg)