
-p-130x130q80.png)
When my data lead asked me to recreate a Looker dashboard on the Power BI platform, I was curious as a user of Looker/Data Studio to try out this data visualization tool myself.
My first impression of Power BI was that its interface looked like any other Microsoft office product. While Looker Studio has its own set of unique features and advantages, Power BI offers a compelling alternative for users looking to create visually appealing and data-rich dashboards.
One of the standout features of Power BI that impressed me was its sleek and modern user interface. The platform provides a clean and intuitive experience for creating dashboards and visualizations, making it easy for users to quickly understand and explore their data.
In terms of data analysis capabilities, Power BI offers a wide range of tools and functions, including drill-downs, data slicing and dicing, and the ability to create custom visuals. These features allow users to dive deep into their data and gain insights into complex relationships and patterns.
In this post, I will demonstrate how to start with Power BI. And cover important parts of data integration and connection between BigQuery and Power BI and basic steps to create a data visualization dashboard. In addition, I will also provide a comprehensive comparison between Power BI and Looker Studio at the end of this blog post.
To begin with, Power BI is one of the most popular business intelligence and analytics solution in the world. But a lot of people get confused with Power BI products, especially with the desktop and online versions.
What is the difference between Power BI Desktop and Power BI Service?
Power BI Desktop is the on-premise (Windows) version of Power BI. It’s the free version that has data analysis and reports creation capabilities.
With Power Query Editor (Query editing Application within Power BI Desktop, you can use it to connect to lots of data sources and transform the data into a model and create reports on your local computer. Also, you primarily don’t need the internet for the desktop version to work.
Power BI Service, on the other hand, is the online version of the Power BI desktop. It enables you to access your locally created dashboard from a Power BI desktop or create an entirely new dashboard completely online. With Power BI service, You can perform tasks such as creating and sharing apps, creating dashboards, as well as exploring and analyzing data to uncover business insights.
I personally used Power BI Desktop for all the heavy-duty work. Such as data integration, building data models, and creating a dashboard on my local computer then I used Power BI Service to access my dashboard online and share the dashboard with my colleagues. (Demonstration coming up in next sections)
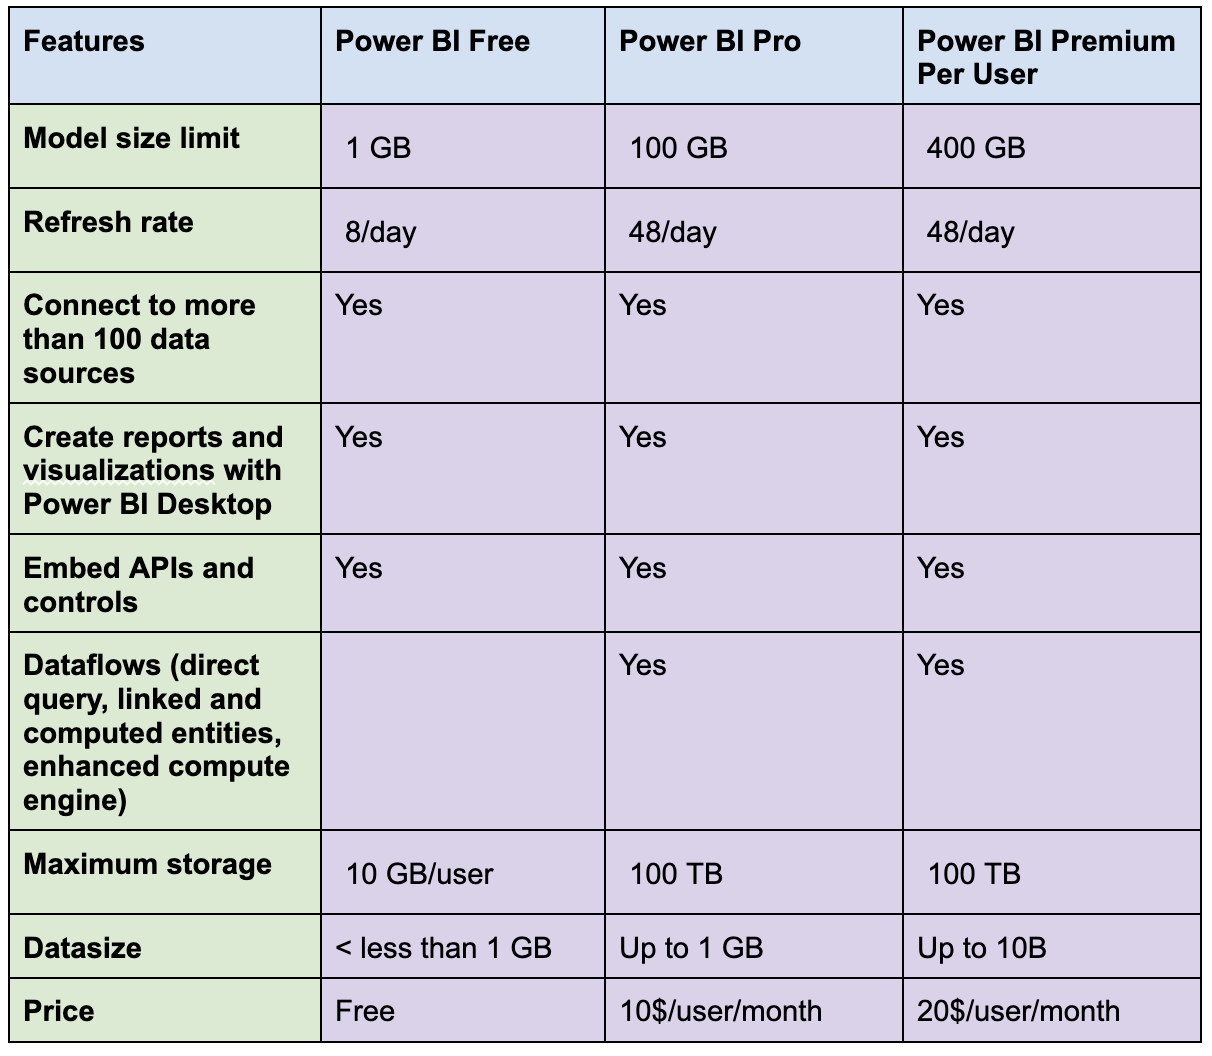
What is the difference between Power BI free, Power BI Pro, and Power BI Premium Per User?
Power BI Free: This is a basic version of Power BI that provides you with the ability to create simple reports and dashboards using limited data sources. Power BI Desktop is the only app among three different Power BI products that allows the creation of DAX (Data Analysis eXpressions) measures, calculations, and column calculations. You can access and share your reports and dashboards with others, but 2 or more people won't be able to edit the report at the same time.
Power BI Pro: This version of Power BI provides you with more advanced features such as the ability to edit dashboards and collaborate with others in real time, access to more data sources, and the ability to schedule data refreshes. It's a paid version, and you'll need to pay a monthly fee to use it.
Power BI Premium Per User: This allows users to purchase premium features on a per-user basis. The benefit of this model is that it provides a more predictable and scalable experience for users, with a predictable cost structure that grows with the number of users. It differs from Power BI Premium Capacity in that it provides a dedicated capacity to each user, rather than a shared pool of resources that multiple users can access. If you're just starting out, you might want to try Power BI Free and then upgrade to Power BI Pro or Power BI Premium as your needs grow.
I used a 60-day free trial of Power BI Pro to test and run my first Power BI project.
Starting with Power BI Desktop
Now let’s get started
Step 1: Download Power BI Desktop from Microsoft Store
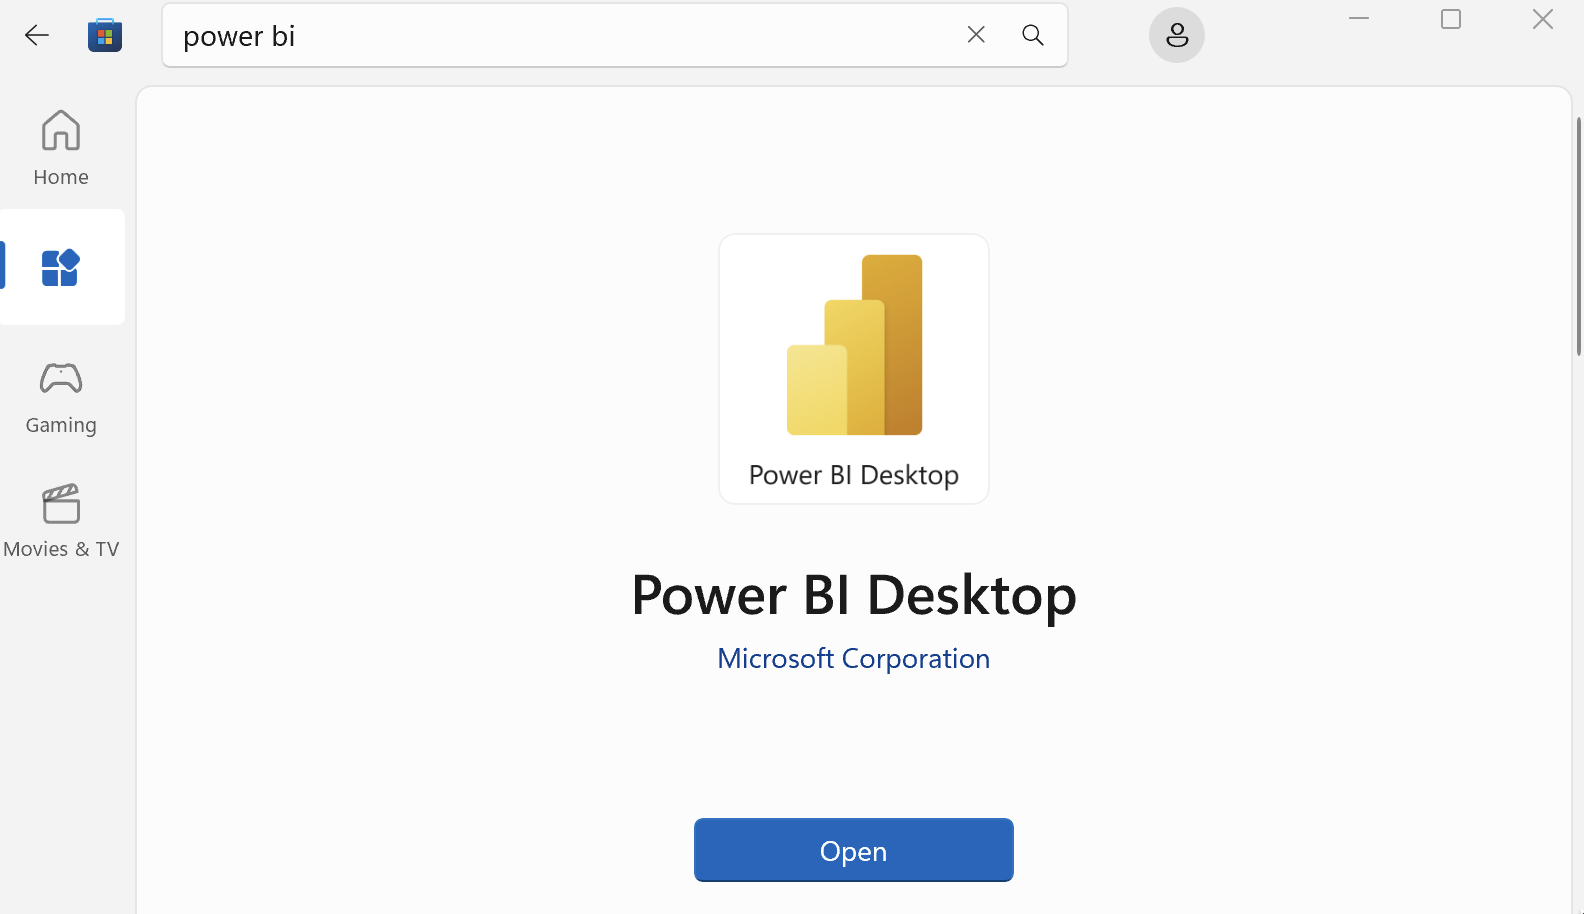
The installation is pretty straightforward.
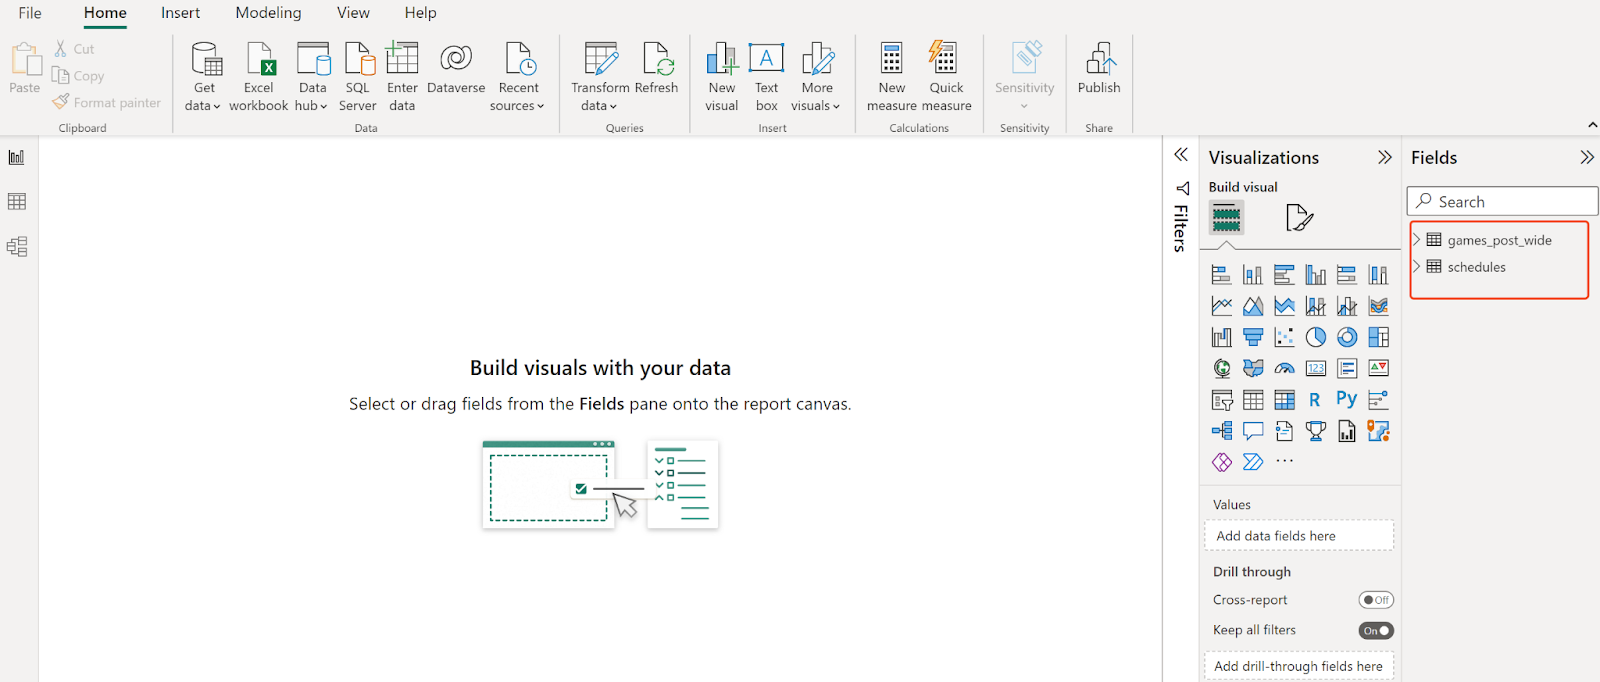
Step 2: Once the Power BI Desktop is installed on your local computer, open a new file in Power BI Desktop. You will see a window like below.

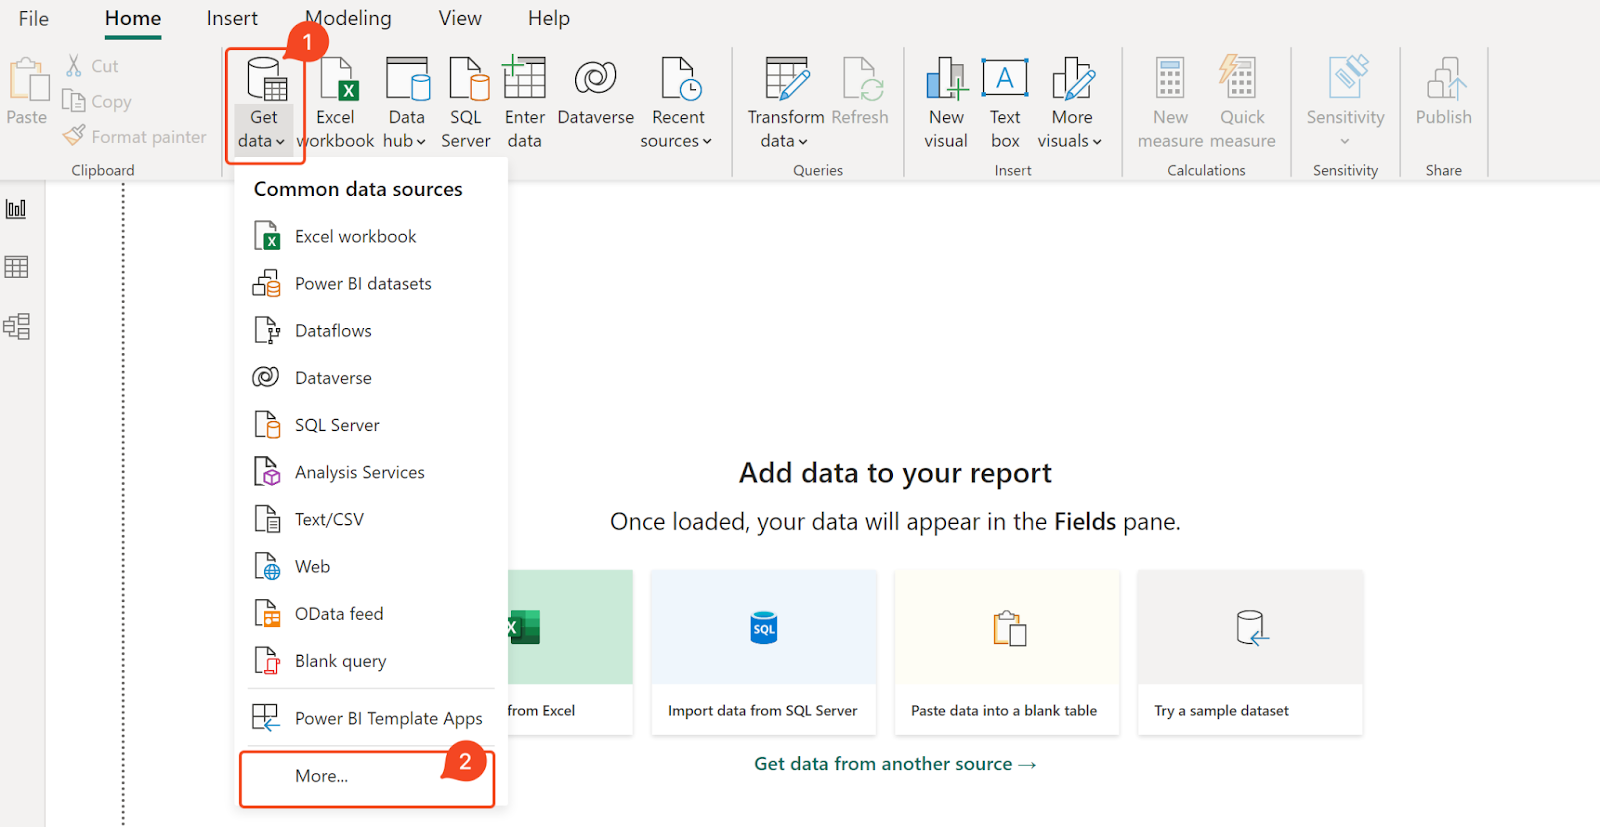
Step 3: Select Get data from the Ribbon inside the home section and select more
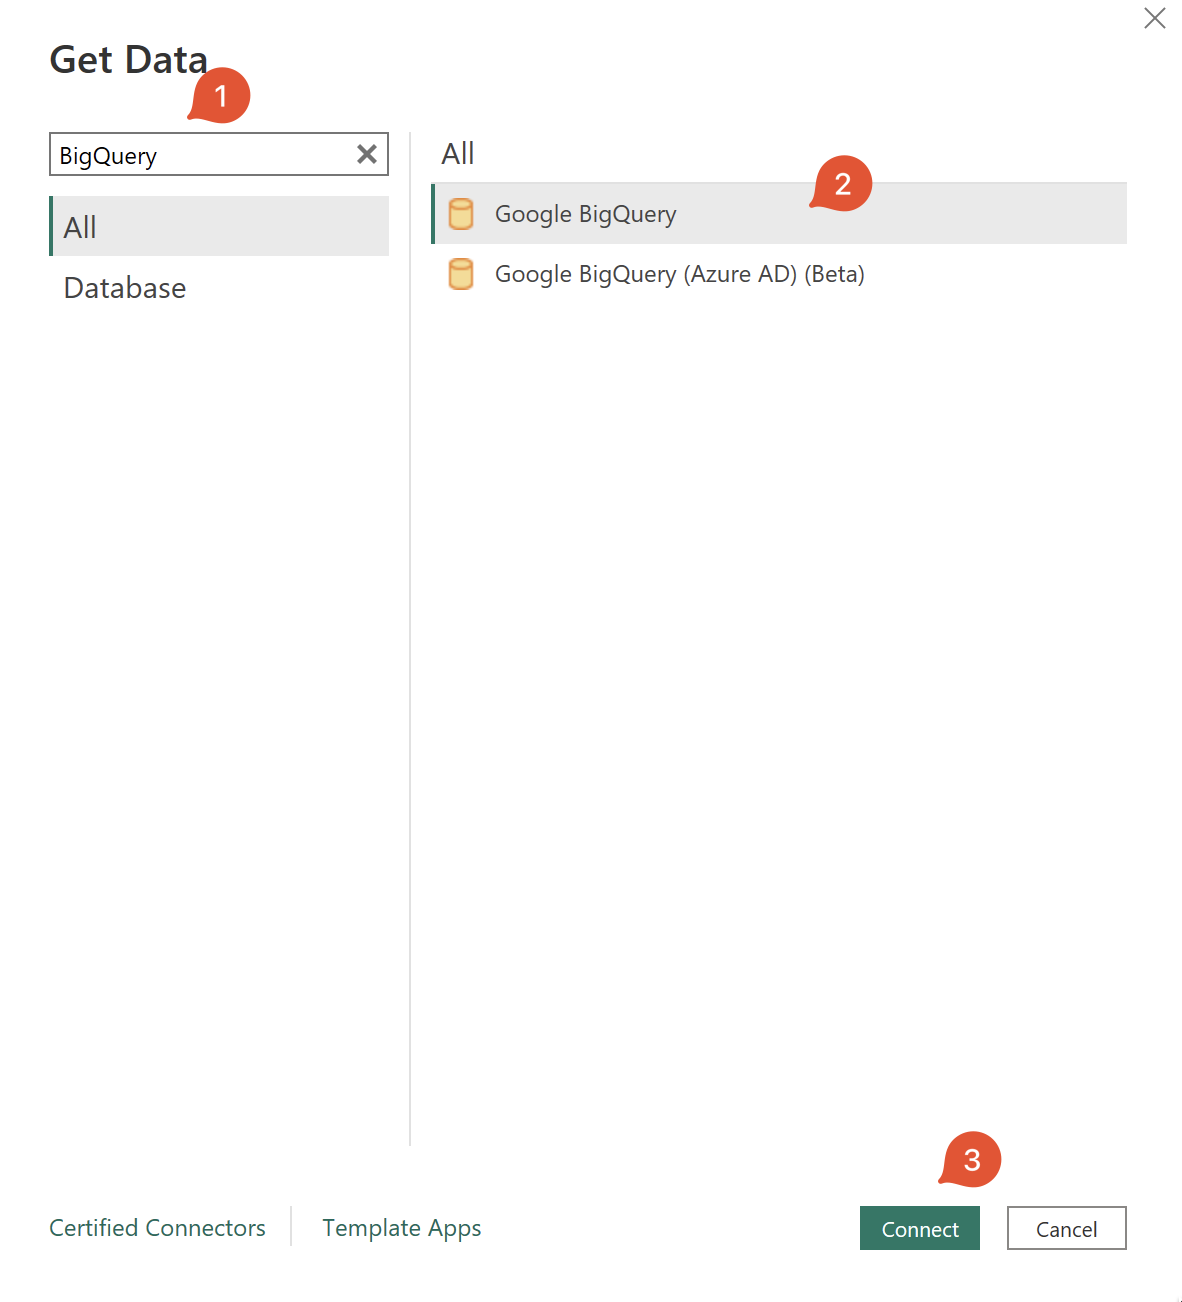
Step 4: Since my project data was stored in BigQuery, I will use a public dataset from BigQuery to simulate my project report. Once you select “more”, type BiqQuery in a search bar section, select Google BigQuery, and then click connect.
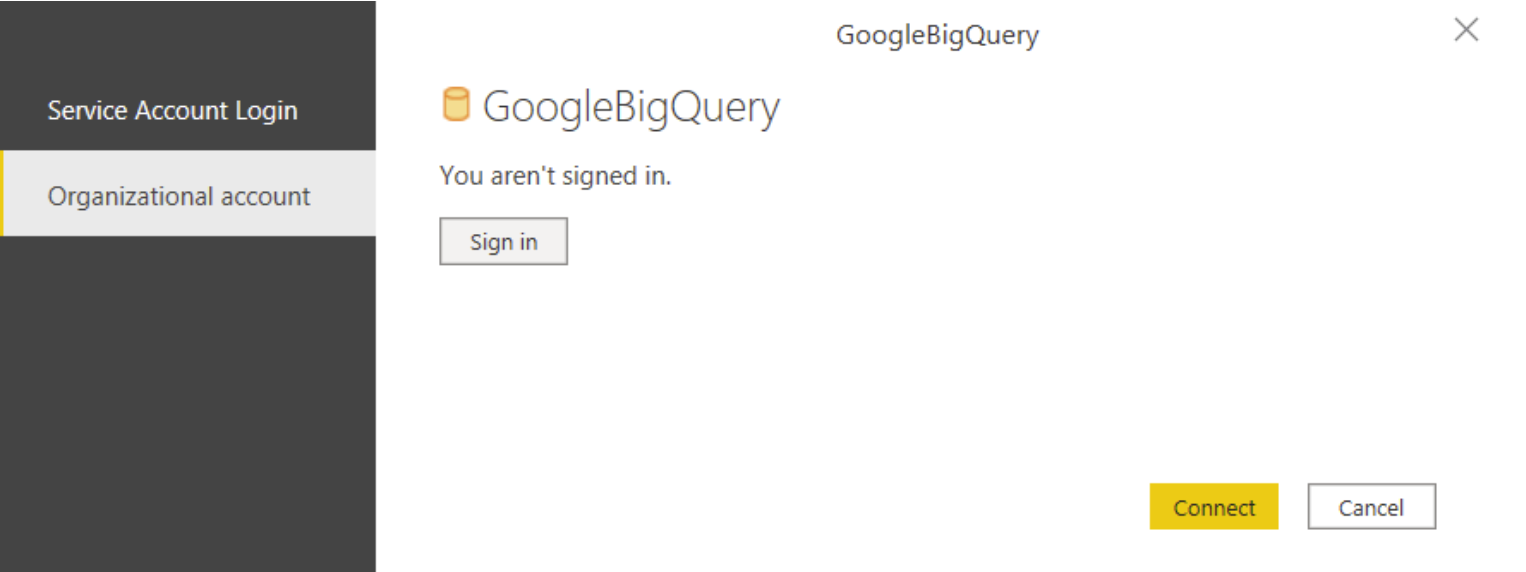
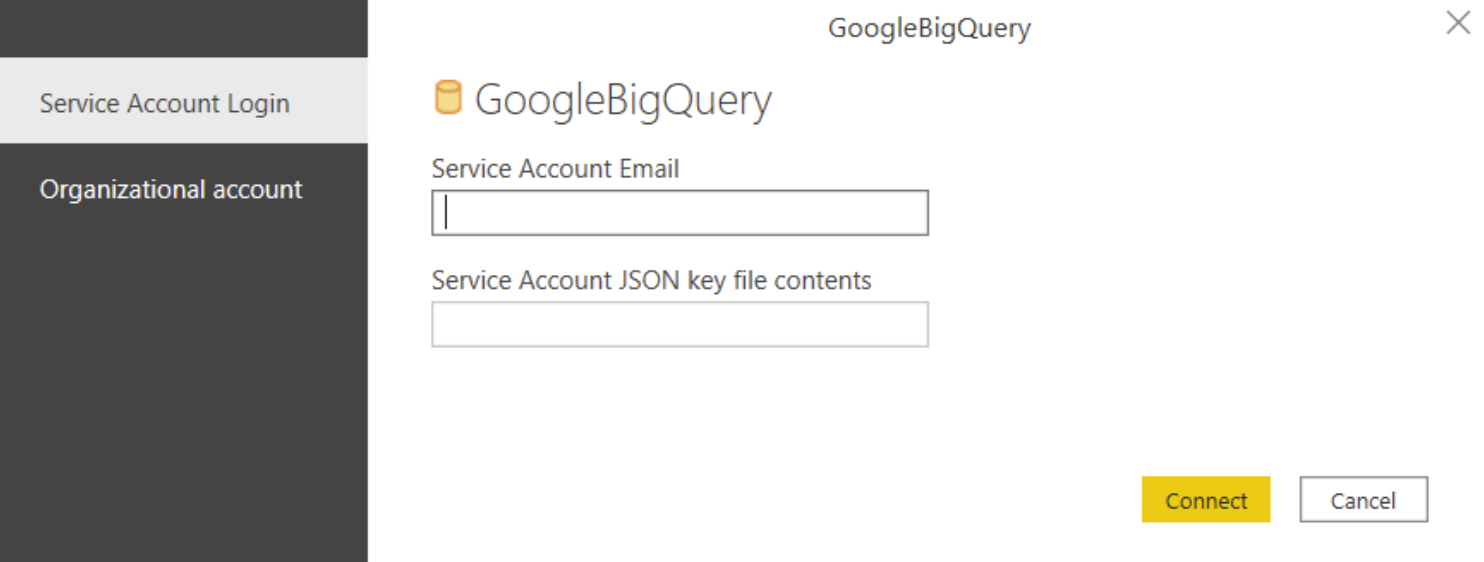
Step 5: Now you need to connect BigQuery to Power BI. This can be done in two ways:
Organizational account – click the Sign in button and follow the usual flow.
Service Account Login – specify your Service Account email address and JSON key file contents. You can create a service account email address by following this link.
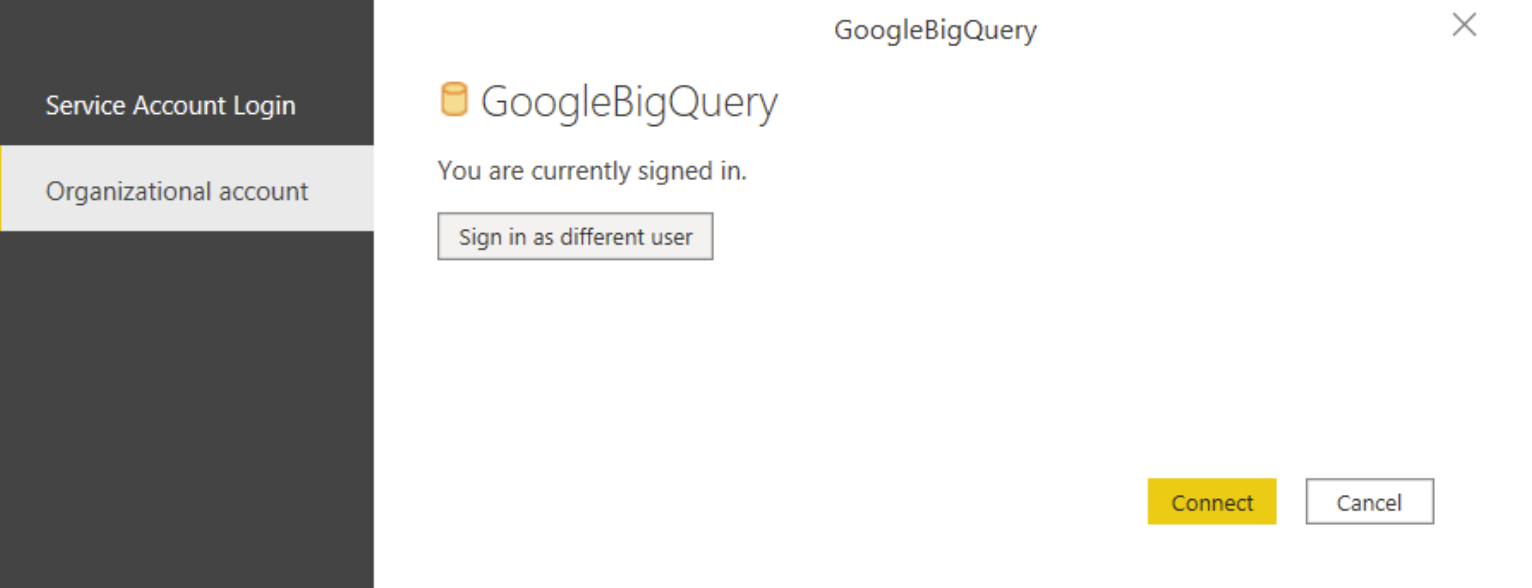
For the purpose of this setup, I will use an organizational account. Click the Sign In button and allow Power BI Desktop to access your Google account. Once signed in, you will see a respective message on the screen. Click Connect to proceed.
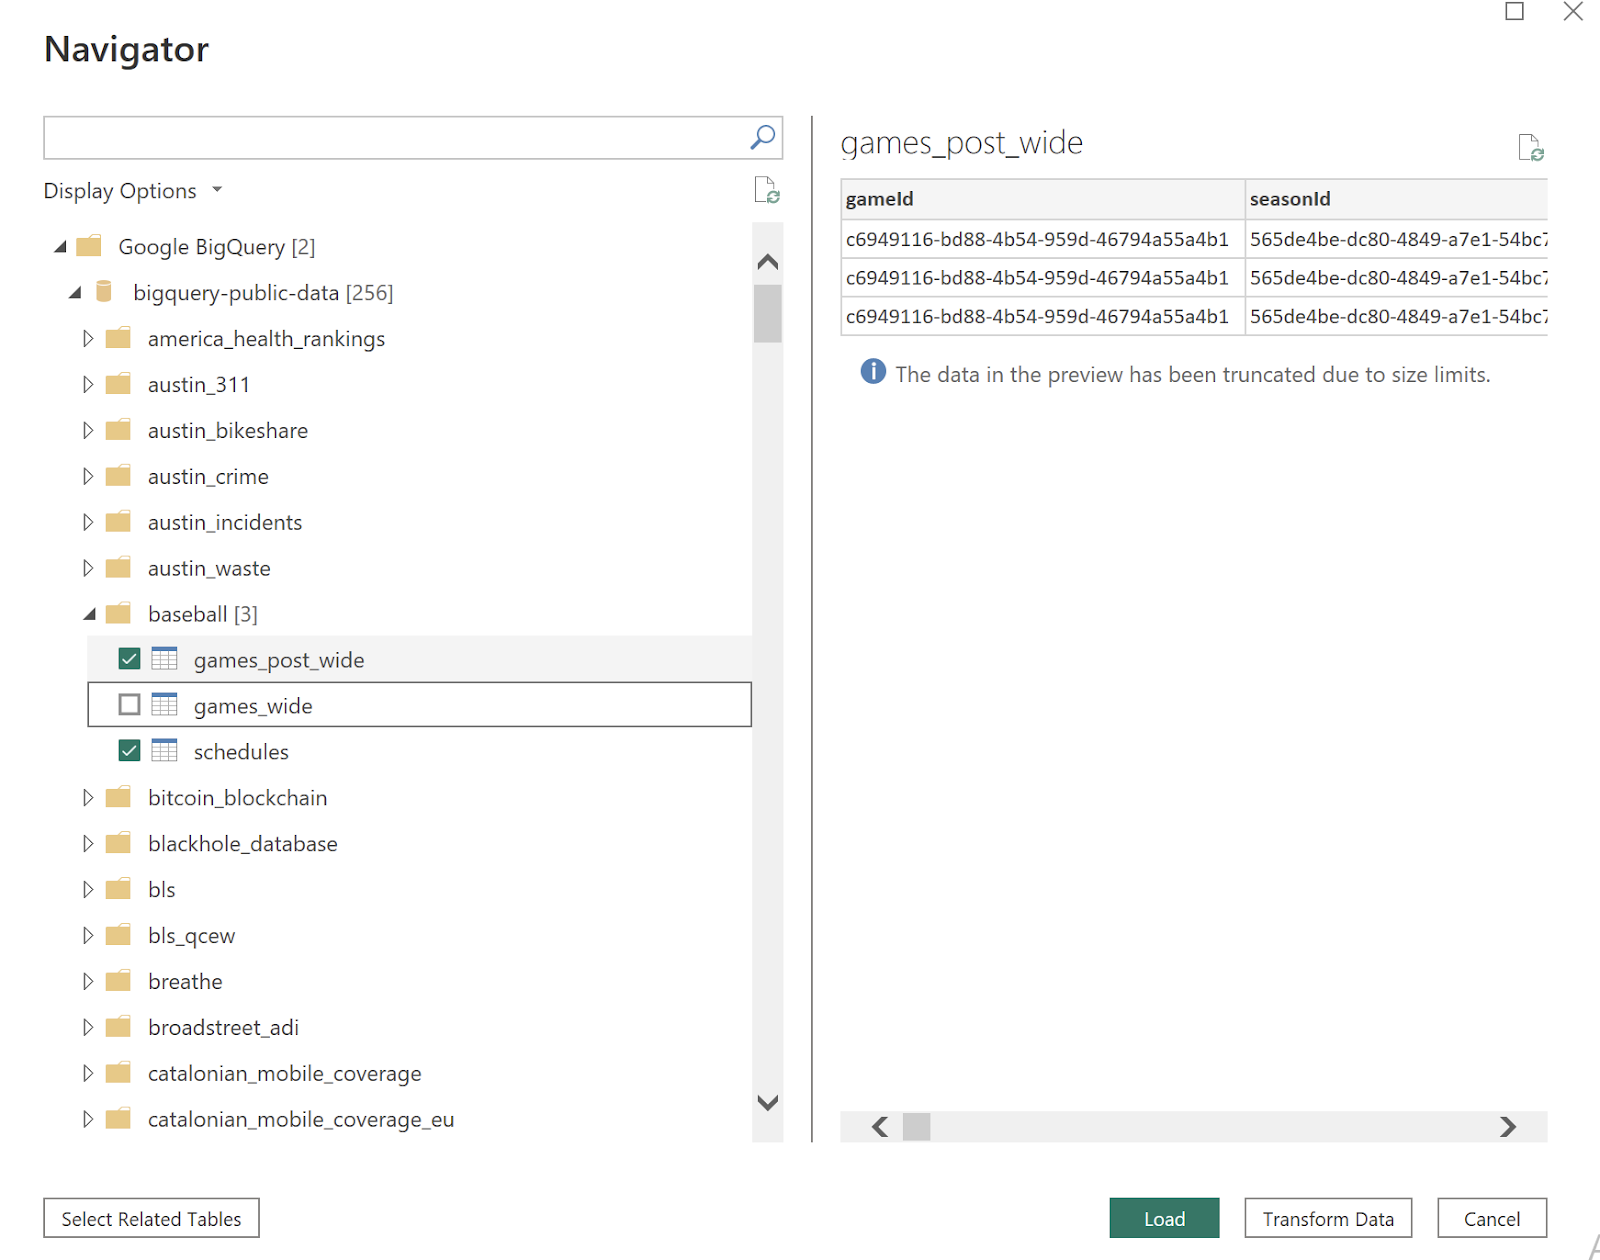
Step 6: A Navigator window will appear in which you can choose data from the BigQuery project. For the purposes of this setup, I choose the baseball dataset and then loaded the data.
Step 7: Finally select the connection setting. There are two types of importing options:
- Import – to bring a copy of the selected dataset into Power BI (No live connection)
- DirectQuery – to set up a live connection to this dataset (Real-time data)

I am using Import mode since BigQuery public dataset is not available in real-time.
Step 8: When the data load is complete, you will see your tables on the right-side panel of the window.
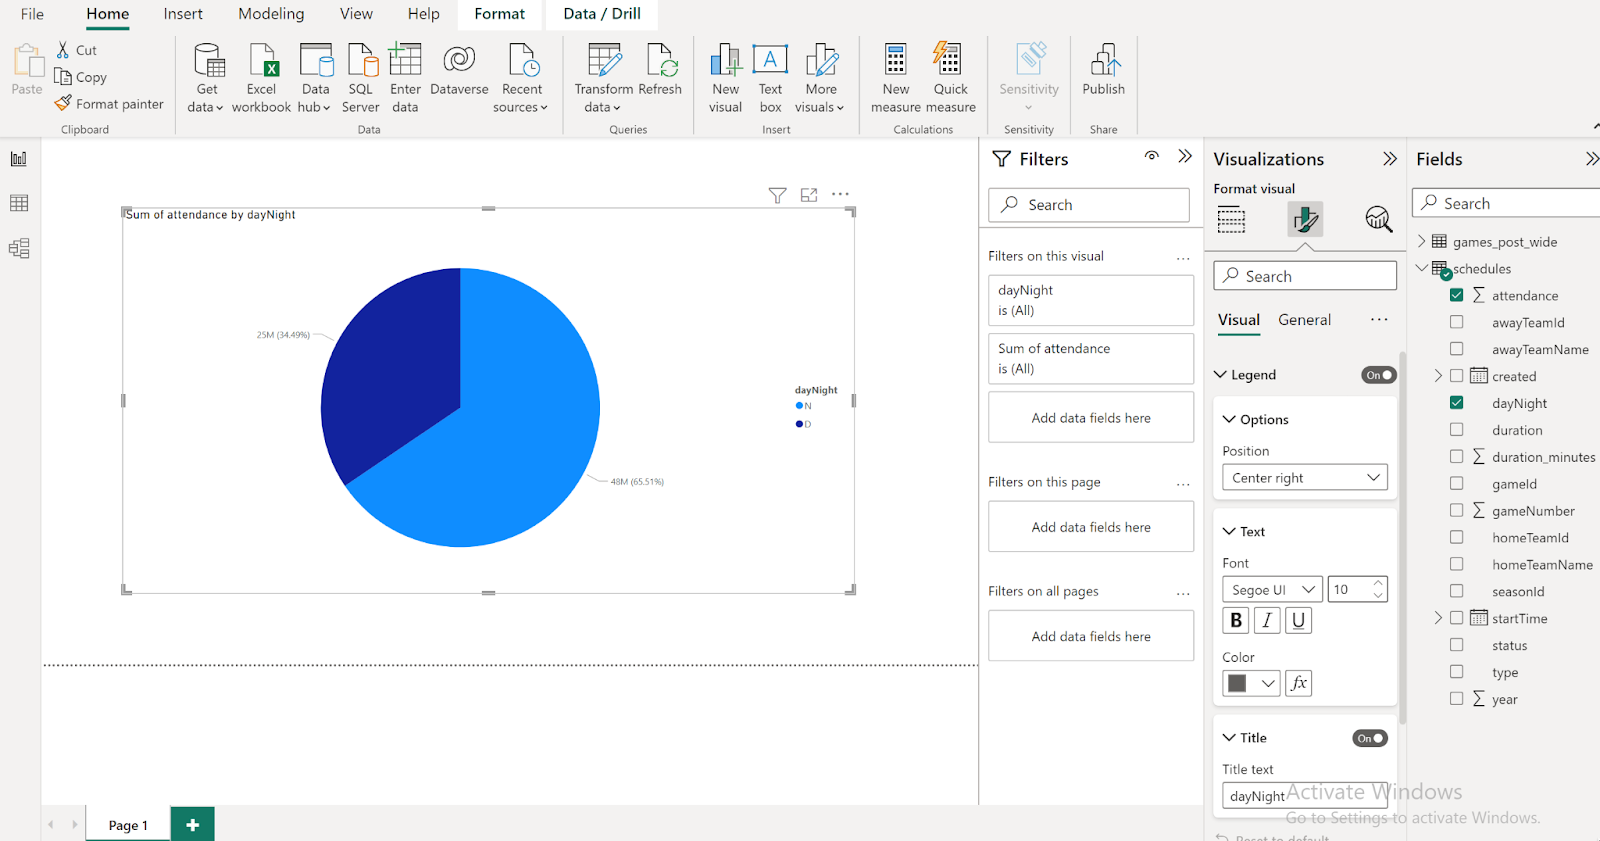
Step 9: Select the type of chart from the visualization panel on the right. For example, a Pie Chart, then add a legend and values.

This is how the pie chart will look in the report. You can also style your pie chart at this point.
Check out this link - how to style and beautify a Power BI dashboard
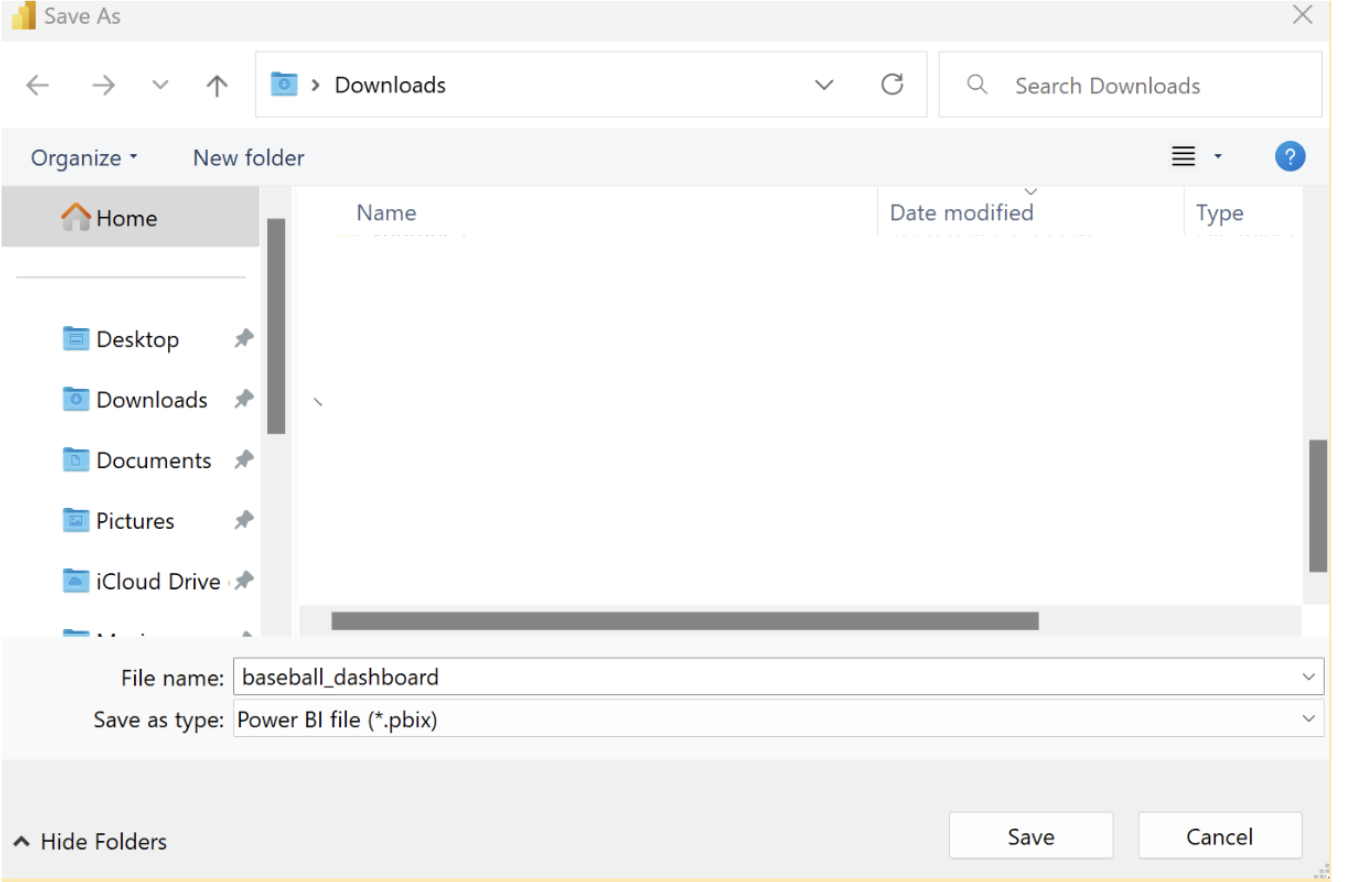
Step 10: Save the Power BI file.
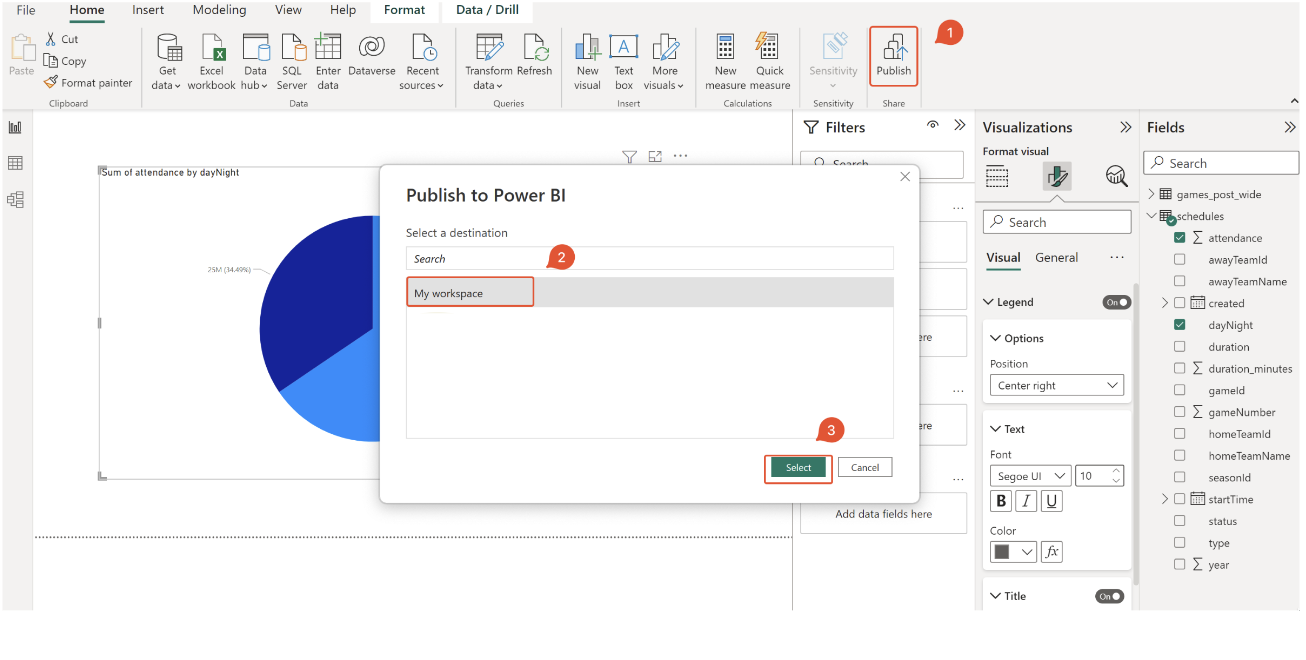
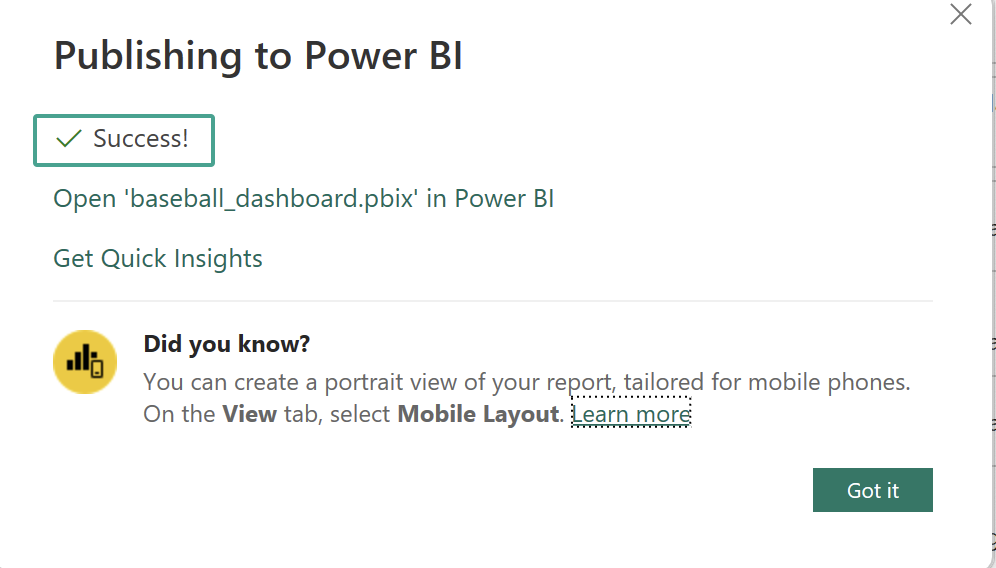
Then publish the dashboard to your Power BI service. By selecting publish button from the Ribbon under the Home section.
Starting with Power BI Service
Step 11: Next, Open Power BI. Sign In to Power BI. Then go to My workspace to access your dashboard.
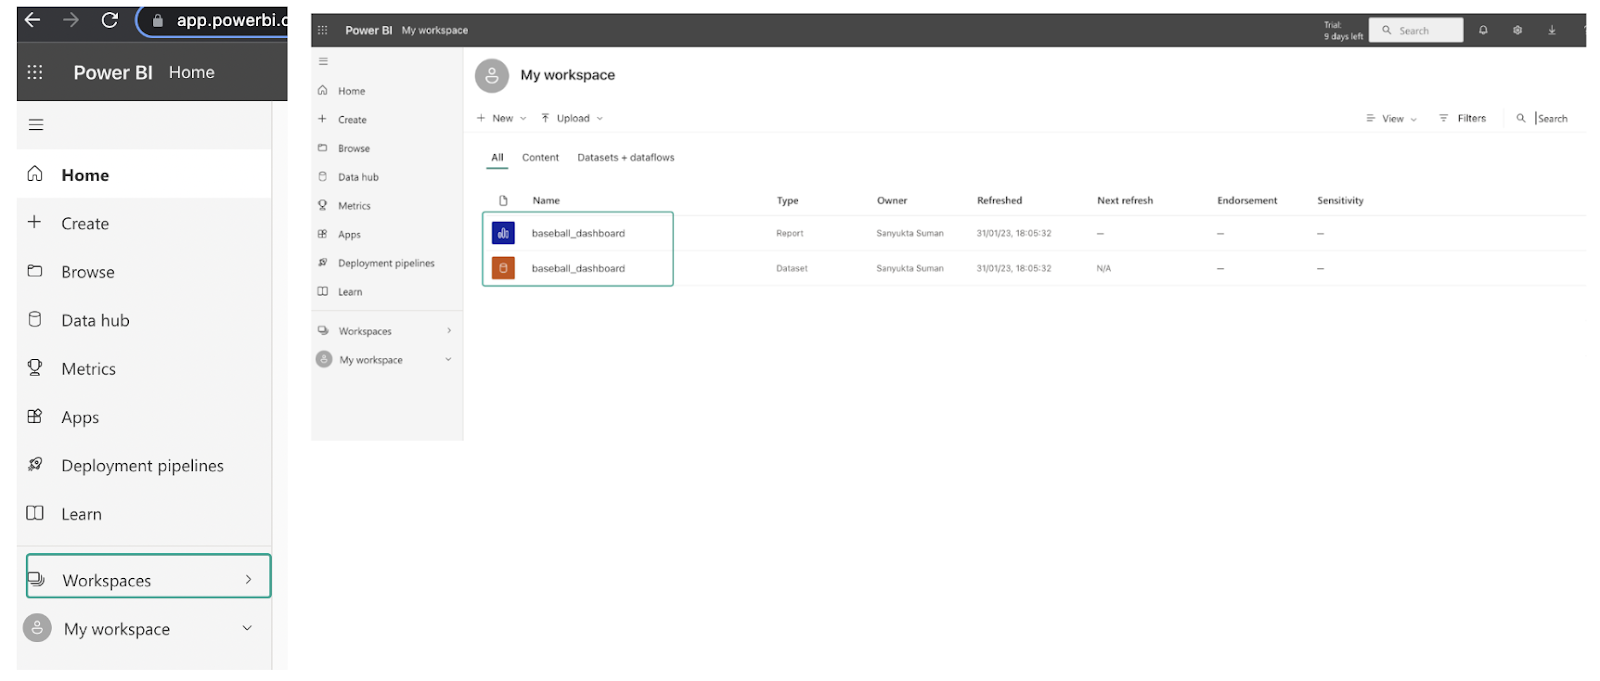
On your workspace page, you will see two types of files - Report and Dataset.
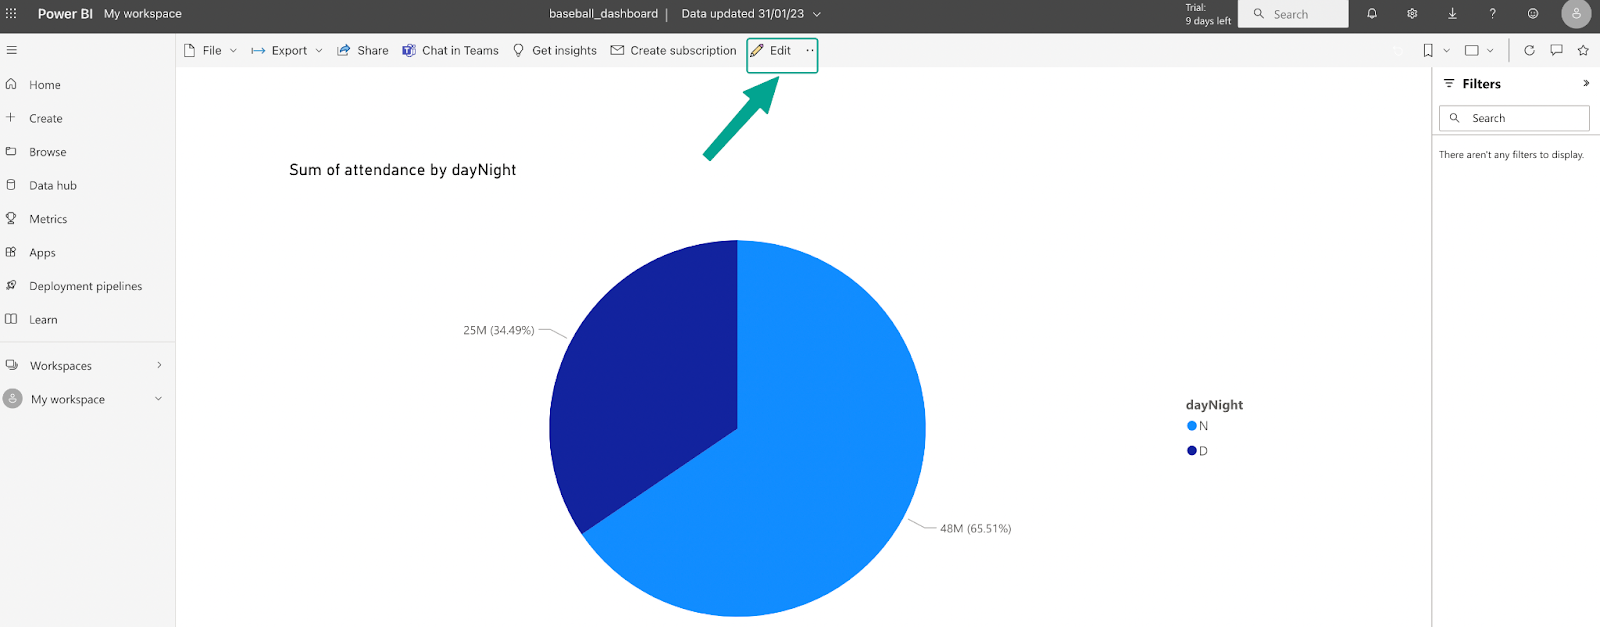
First, click on the report, and you will be redirected to your dashboard page. You can edit your dashboard further by clicking the edit button from the menu bar at the top of the window
Next, go back to your My workspace page and open the dataset file, you will see your tables located at the right side of the window
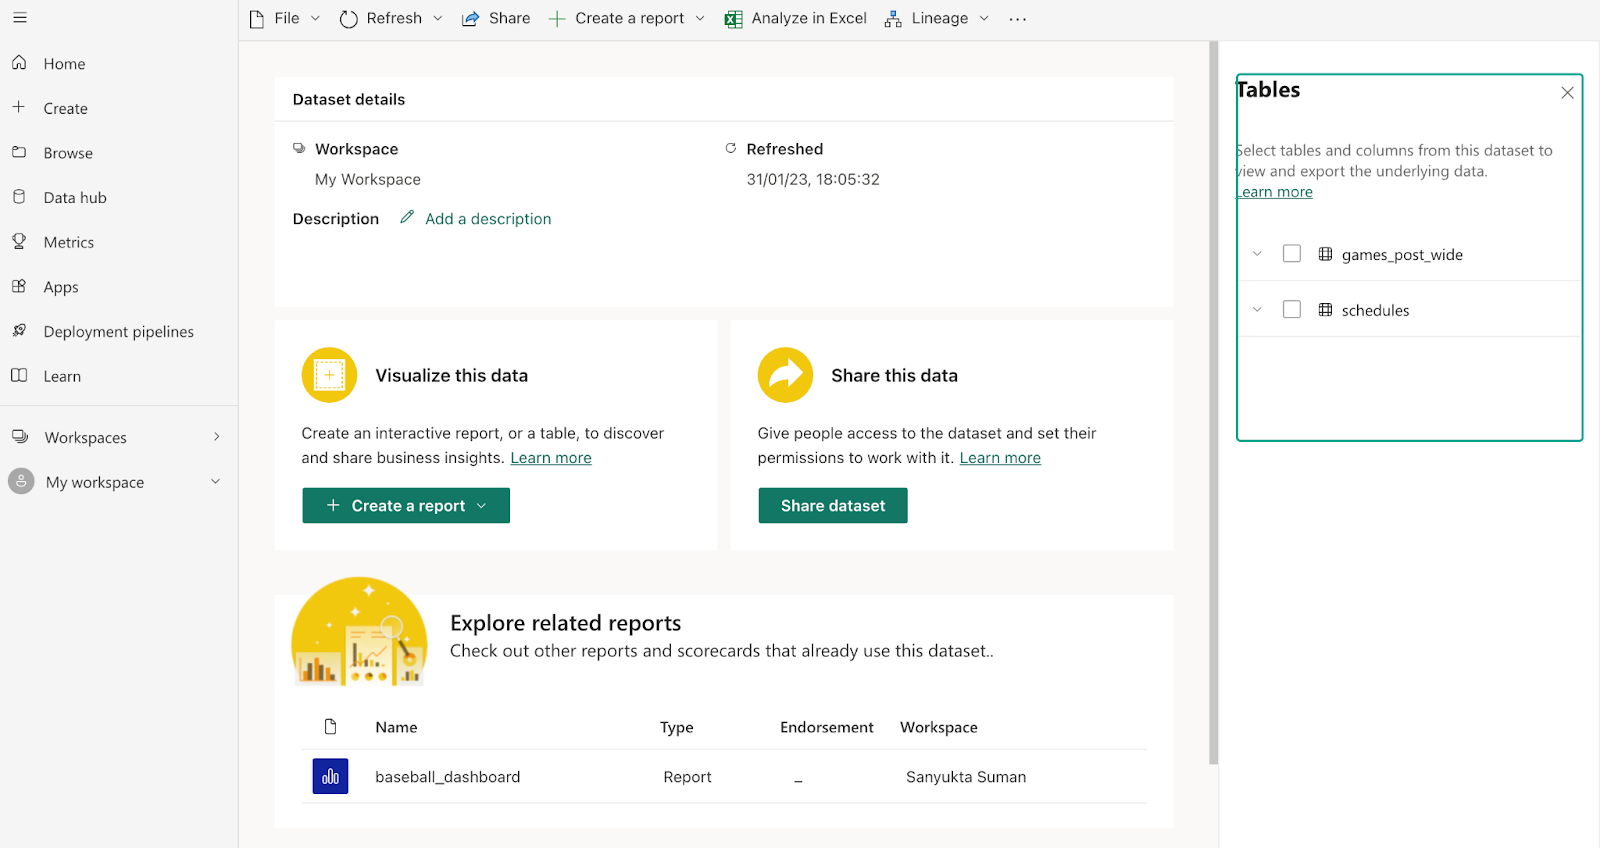
That’s it!
So, now that you have a basic understanding of what Power BI is and what it can do, I encourage you to explore the tool on your own. Take the time to play around with its interface and see what kind of reports and dashboards you can create with the data you have. Don't be afraid to experiment and try out different features and techniques. The more you use Power BI, the more you'll understand its full capabilities and the more confident you'll become in creating dynamic and engaging data visualizations. Remember, the best way to learn is by doing, so go ahead and dive into Power BI today!
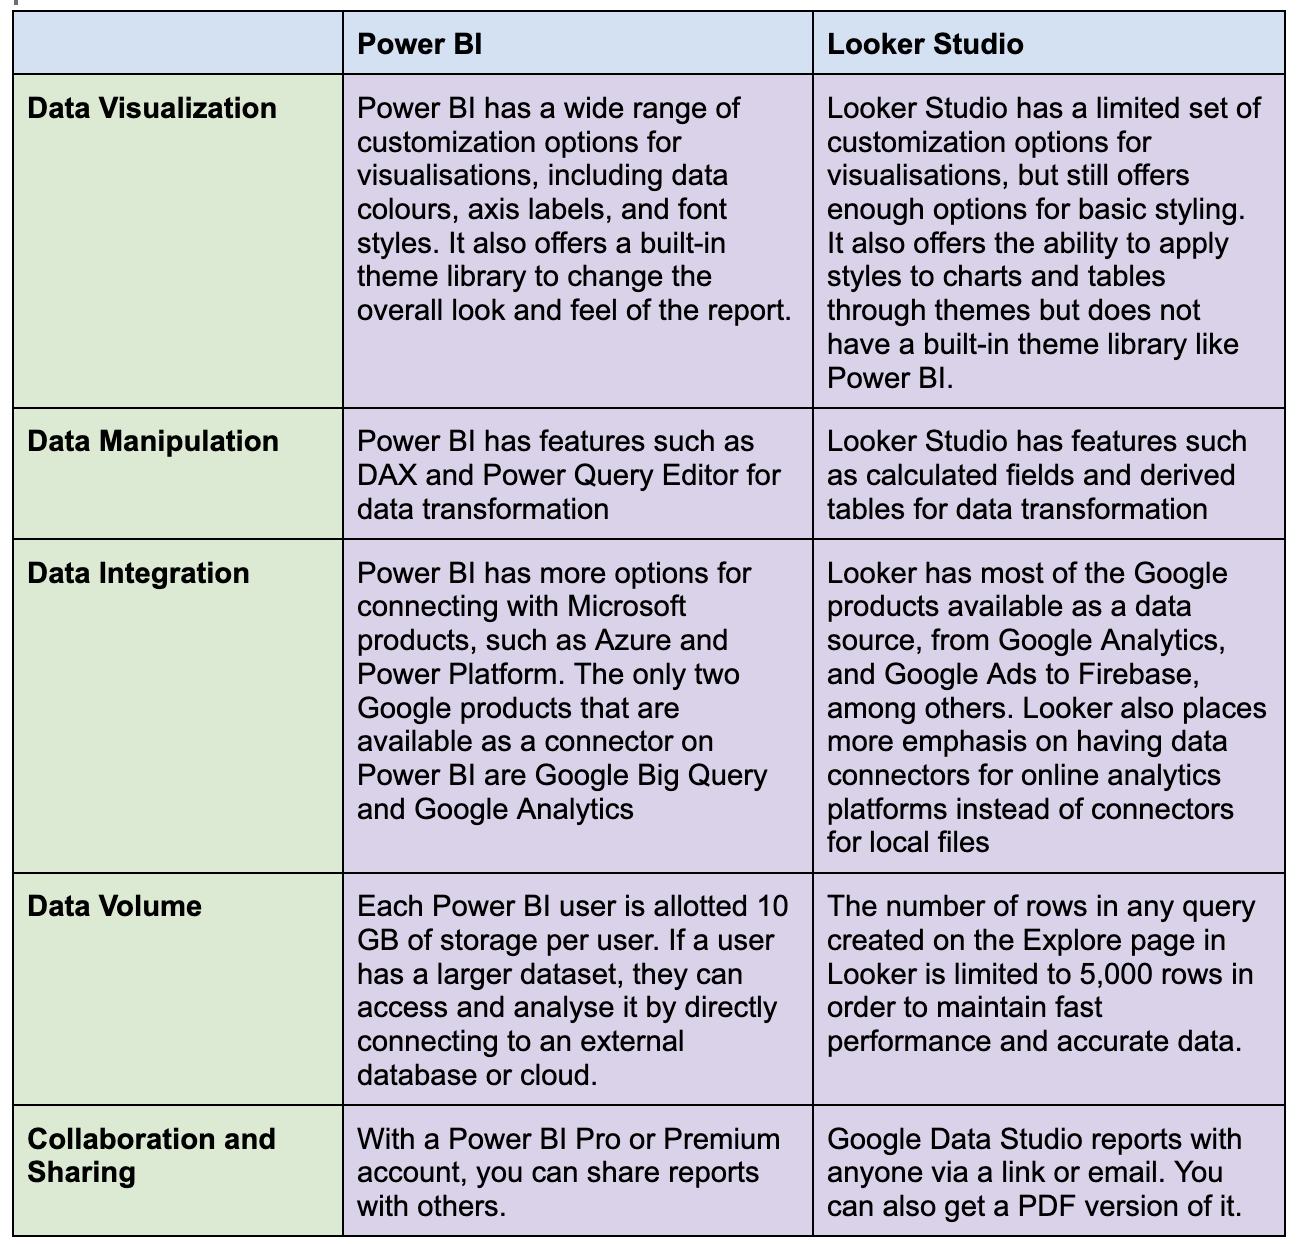
Difference between Power BI and Looker Studio
Finally, after working with both Power BI and Looker Studio. Based on my experience, here are key differences between Power BI and Looker Studio
Additionally, some metrics were renamed (e.g Item list clicks to Item-list clicks or Item purchase quantity to Item purchased).
Conclusion
If you're looking to expand your data visualization skills, Power BI is a powerful tool that can help you create dynamic and interactive reports and dashboards.
In the upcoming chapter of the Power BI series, you'll learn more advanced topics such as how to use DAX, how to style dashboards, and how to connect real-time Big Query data with Power BI, which will enhance your ability to analyze, visualize and present data in a meaningful way.
Further Links
This post is part of the Complete Guide to Power BI Data Analytics series from datadice and explains to you every month the newest features of Power BI.
Datadice also releases a new blog post every month about the latest features in BigQuery, Looker Studio, Power BI, Google Analytics, and Google Tag Manager. Check out more blogs here.
Check out our LinkedIn account, to get insights into our daily working life and get important updates about BigQuery, Data Studio, and marketing analytics
We also started with our own YouTube channel. We talk about important DWH, BigQuery, Data Studio, and many more topics. Check out the channel here.
If you want to learn more about how to use Google Data Studio and take it to the next level in combination with BigQuery, check out our Udemy course here.
If you are looking for help setting up a modern and cost-efficient data warehouse or analytical dashboard, send us an email at hello@datadice.io and we will schedule a call.
.jpeg)