-p-130x130q80.png)
For a couple of weeks, we have been posting on different data manipulation functionalities in Y42. Please refer back to the previous blog on this series. In this post, I’ll show two more nodes for data manipulation.
With our love for the F1 race, we created our own small company betting system. Before each race, we sent out the bets in Google Forms and collect the bets in Google Sheets and for each correct guessing, a point is rewarded. As of the current date, there have been already 9 races, which means we have 9 Google sheets for betting results.
I have already integrated the google sheet in Y42, and if you are still in the beginner's phase and have no idea, what integration means or how to import the data in Y42, please have a look at our post here.
Union
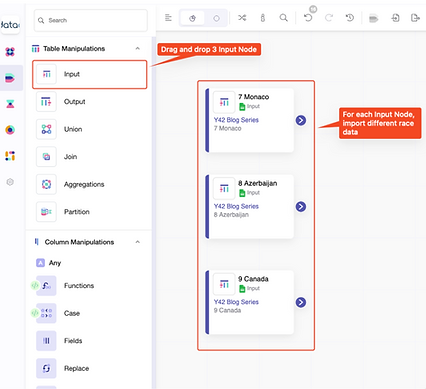
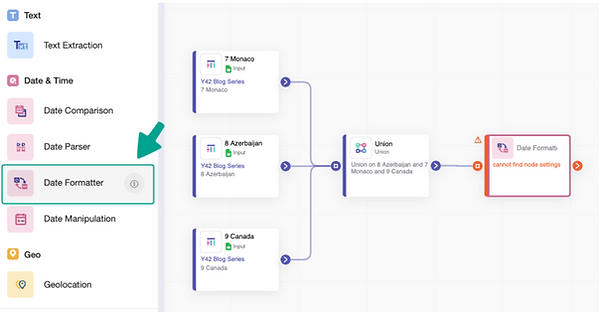
For this post, I will use only 3 of those files and show how to ‘union’ all the data into one table. To get the data from each file, we drag and drop the Input Node in the canvas and if everything went well, it should look roughly like the following:
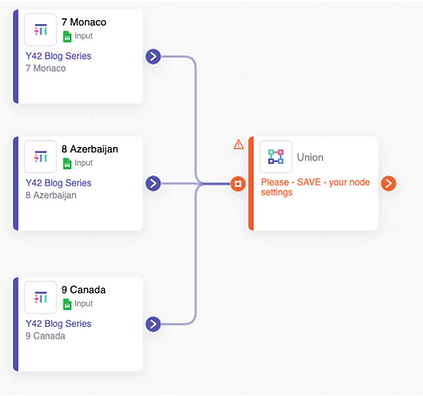
Now to combine all the data, we use the UNION node, which is 2 steps below the Input node. Then join all the arrows to the union node and click on it for further implementation.
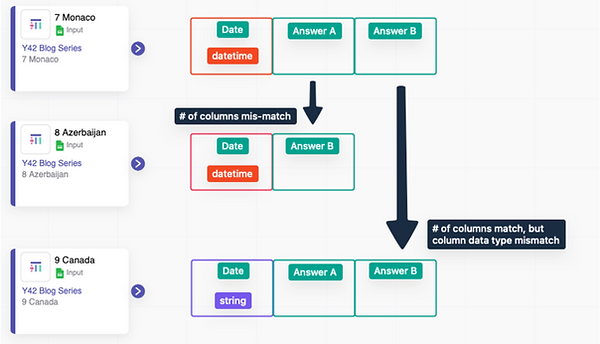
Before going further, I would like to point out two essential criteria, which has to be fulfilled before using the union node:
- The number of columns from each table should be the same
- The columns need to be of the same data types.
For example:
- input node “7 Monaco” has 3 columns and the first column has the datetime data type
- input node “8 Azerbaijan” has only 2 columns
- last node ”9 Canada” has 3 columns but the first column has a string data type
Then none of these tables can be combined together. Input Monaco and Azerbaijan have different numbers of columns and Monaco and Canada have different data types. You can imagine this whole process as stacking a table on top of another and in doing so, all the columns need to be the same size and type.
Now to the implementation:
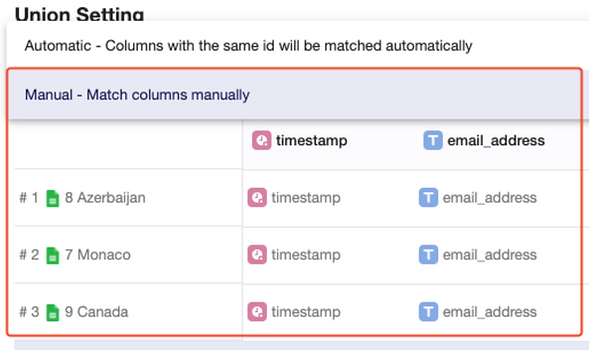
There are two Union Settings options: ‘Automatic’ and ‘Manual’. If Automatic is selected, Y42 will figure out to set the columns by matching the same id. You can also choose Manual. With this option all the different columns from all the tables are shown as highlighted in the figure above. You can move around the columns if they are in the wrong position. How do you move the columns, you ask? It's Y42, everything is drag and drop😎. When all the columns are matched then, as usual, you can have a preview by clicking on Output and Save the node settings.
Date Formatter
As we know already, our first column is a datetime, i.e. this column will have the date and time when the employee has entered the responses for the bet. Let’s make two new columns, which will have date and time separately. Then let's begin it by clicking Date Formatter from the ‘Date & Time’ section.
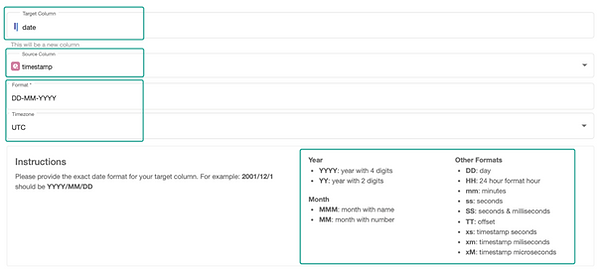
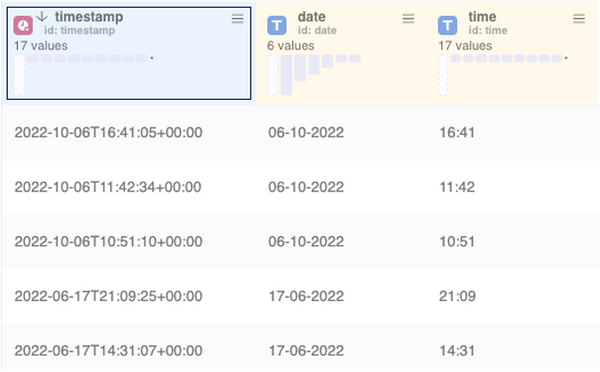
First, let’s look at how to get the date from the timestamp column. Inside the Date Formatter node, let’s give the target column the name ‘date’ and choose the source column ‘timestamp’. For the format type we take ’DD-MM-YYYY’, which will then show the date in a day, month, and year format. If you are confused about how to format the date, then Y42 has documentation below.
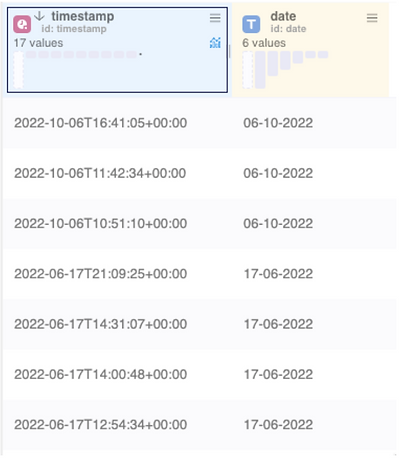
Then the preview will look something like this:
Similarly, for the time column, we don’t need to add another node but we can click on the “+” symbol below the Instruction and it will create another section for time formatting. Here, as shown above, we will name ‘time’ for the target column and select timestamp as source column and in the format, we will type ‘HH:mm’, which will show 24-hour time format.
Conclusion
With these two nodes, you should be able to merge multiple tables and extract date and time from a datetime column. In upcoming posts, we will explore other rich & exciting nodes and explain how they work. In the meantime, if there are questions on these topics or any troubleshooting, don’t hesitate to contact us.
Further Links
This post is part of the Y42 series from datadice and the series gives you detailed information on different features in Y42.
If you think that Y42 could be an attractive solution to your data problems, be sure to get in touch with them.
Check out our LinkedIn account, to get insights into our daily working life and get important updates about BigQuery, Data Studio, and marketing analytics
We also started with our own YouTube channel. We talk about important DWH, BigQuery, Data Studio, and many more topics. Check out the channel here.
If you want to learn more about how to use Google Data Studio and take it to the next level in combination with BigQuery, check our Udemy course here.
Have trouble setting up an ETL Pipeline on Y42 or if you are looking for help to set up a modern and cost-efficient data warehouse or analytical dashboards in general, send us an email at hello@datadice.io and we will schedule a call.
.jpeg)